
The Paradox of Plenty: Stable Inefficiency In Indian Banking
What do the various stakeholders in Indian banking – customers, employees, shareholders and the government – really earn from the assets of the financial system? This deceptively simple question forms the starting point of our analysis. By examining data from the Reserve Bank of India (RBI) over the past 25 years, we seek to understand how value has been distributed across these groups and what it reveals about the evolution of Indian banking.
Our findings, summarised in the accompanying charts, offer a revealing portrait of stability, inefficiency and asymmetry in value creation. Despite massive expansion in scale and competition, the distribution of returns across stakeholders has changed remarkably little. The banking system has grown over 25-fold in assets; yet the core economics – who gains, who bears risk and who absorbs losses – remains largely the same.
Mapping the stakeholders
The Indian banking system has five principal claimants on its value creation:
Customers, comprising both borrowers and depositors, who are the primary users of the system’s financial intermediation.
Employees and vendors, who extract returns through operating expenses – salaries, benefits and payments for outsourced services, technology and infrastructure.
Shareholders, who receive residual profits after all costs, taxes and provisions.
The government, which earns taxes and dividends while also functioning as majority owner of public-sector banks (PSBs).
Defaulting borrowers, a less conventional but very real stakeholder class, who extract value through credit losses absorbed by banks.
Each stakeholder’s returns can be traced through specific financial ratios that link the system’s balance sheet to its income distribution.
Measuring the claims
For employees and vendors, the relevant indicator is the operating cost-to-average-assets ratio. Banks’ non-interest expenses – largely staff and technology costs – represent the aggregate compensation to those providing labour and operational support.
For the government, the tax-to-assets ratio captures its direct fiscal claim on banking profits. This excludes the implicit return it earns via the statutory liquidity ratio (SLR) mechanism, which compels banks to hold a minimum share of deposits in government securities, thereby providing a stable source of public financing.
Shareholders’ returns are best represented by the post-tax return on assets (RoA) – the residual profit after all other stakeholders have been paid.
Customers’ gains, however, are more complex to measure. The net interest margin (NIM) – the spread between banks’ yield on assets and their cost of funds – serves as a proxy for the efficiency and competitiveness of the system. Over time, a more efficient banking system should translate into narrower NIMs: borrowers paying less for credit and depositors earning more on savings.
Finally, credit cost provisioning reflects the value extracted by defaulting borrowers. When banks set aside provisions for non-performing assets, they effectively transfer value from shareholders (and, indirectly, taxpayers in state-owned banks) to delinquent borrowers.
Figure 1 presents these five metrics for the Indian banking system between 2001 and 2024.

Figure 1: Ratio of key parameters to average assets of Indian banking, 2001-2024. Source: RBI, authors' computations.
Stability amid transformation
At first glance, two features stand out: the extraordinary stability of NIMs and operating costs.
The NIM for the Indian banking system has hovered between 2.5% and 3% for nearly a quarter of a century, exceeding this range only briefly in the post-pandemic years. After reaching its lower bound in 2018, margins have edged upwards again – a reflection of the system’s shift towards higher-yielding retail credit, particularly unsecured consumer loans and credit cards, in the wake of the mid-2010s corporate bad-loan crisis.
This stability is striking when set against the scale of change. Total banking assets in nominal terms have surged from Rs 11 trillion in 2000 to Rs 281 trillion in 2024, a 25-fold increase. Meanwhile, the structure of the industry has been transformed: private-sector banks, which accounted for roughly 10% of assets in 2000, now hold about 45%. Yet neither scale nor competition appears to have compressed margins for customers.
The comparison with global peers is telling. Over 2020-24, US banks reported an average NIM of 2.86%, while European and Chinese banks operated at far thinner spreads of 1.45% and 2.18%, respectively. By this measure, Indian customers – both borrowers and depositors – continue to pay far more for financial intermediation.
Operating costs show a similar pattern of endurance. After productivity gains in the early 2000s, when the cost-to-assets ratio fell from roughly 2.8% to 2%, the figure has barely budged. Since 2010, operating costs have been anchored around 2%, rising slightly to 2.2% after the pandemic.
Cross-country comparisons1 again underline the puzzle. US banks operate at roughly 2.5%, European peers at 1.4%, and Chinese banks at just 1%. The higher American ratio reflects the inclusion of investment banks with cost-heavy trading operations, but even adjusting for that, Indian banks appear inefficient given their much lower factor costs – especially labour and technology.
Equally puzzling is the absence of economies of scale. Between 2010 and 2024, banking assets expanded 6.5 times in nominal terms, yet operating costs did not decline. This suggests that productivity improvements from digitisation and automation have been offset by rising expenses, perhaps in compliance, risk management or technology upgradation.
The government’s steady take
The government’s explicit fiscal return – taxes paid by banks – has remained remarkably stable at around 0.5% of assets, except during years of depressed profits such as the late 2010s. But this measure understates the full extent of the state’s extraction from banking.
Through the SLR regime, banks are currently required to hold at least 18% of their deposits in government securities. In practice, holdings have consistently exceeded this floor, ranging between 22% and 25% in recent years. This ensures the government an assured and low-cost funding channel for its fiscal deficit.
The state’s dual role – as both regulator and majority owner of PSBs – compounds this. When credit losses rise, the government’s tax revenues fall, and as a shareholder it suffers capital erosion, producing a double blow to public finances.
The volatile two: provisions and shareholder returns
While NIMs, costs and taxes display impressive constancy, the credit cost and RoA metrics are far more volatile – and intimately linked in a zero-sum fashion. Rising provisions signal deteriorating asset quality, which directly erodes shareholder returns.
In India’s case, the burden of credit risk is borne primarily by shareholders, and to a lesser extent by the state through its ownership of PSBs. During the bad-loan cycle of the mid-2010s, provisioning spiked, profits evaporated and returns to equity holders plunged. The data show how periods of rising credit costs coincide with sharp compressions in RoA and, by extension, in taxes paid.
This asymmetry – where shareholders bear downside risk while employees, vendors and even customers enjoy relative stability – underscores the peculiar risk distribution in Indian banking.
It could be argued that shareholders, including the government, would tolerate the considerable volatility stemming from credit cost provisioning, provided the stock market delivered sufficient returns. For this assertion to hold, one would expect a consistent upward trend, or "rating up", in the key valuation metrics for the nation's banking stocks.
To test this hypothesis, we examined the two most common metrics of equity valuation – the price-to-earnings (P/E) ratio and the price-to-book value (P/BV) multiple – for the BankNifty index.
As the definitive value-weighted index for Indian bank equities, BankNifty offers the most reliable long-term data for this sector. We analysed the annual averages of these two metrics from the index's inception in the 2007 financial year through to 2025. The following analysis of the trendlines reveals a striking consistency (Figure 2).

Figure 2a: Price-earnings ratio of BankNifty.

Figure 2b. Price-to-book ratio of BankNifty. Source: AceEquity, authors' computations.
The charts illustrate that the P/E ratio for the period remained largely range-bound, with a notable exception: a significant spike between 2018 and 2020. This period coincided with the peak of the non-performing assets (NPA) crisis, suggesting investor patience during a systemic stress event. It is pertinent to recall that this crisis was heavily concentrated in PSBs, which necessitated an infusion of approximately Rs 4 trillion in capital from the government.
The P/BV multiple demonstrates even greater stability, showing no equivalent spike. Over the entire 18-year period, the P/BV ratio averaged 2.21, with all annual figures remaining within one standard deviation2 of this mean. A similar picture emerges for the P/E ratio; excluding the outlier years of the crisis, the average P/E sits at 16.5, with all other years falling within one standard deviation.
In summary, the established pattern in these valuation metrics suggests a lack of re-rating for the banking sector's equities. Banking stock valuations are largely hovering around the same level observed nearly two decades ago. The analysis concludes that the market has exhibited a remarkable neutrality: it has neither substantially rewarded nor materially penalised bank shareholders for the inherent earnings volatility they have borne.
Diverging paths: public versus private
The system-wide averages mask profound structural differences between PSBs and private-sector banks. Over the past quarter century, PSBs’ dominance has steadily waned: their share of total banking assets has declined from roughly 85% to about 55%. Private banks have gained ground through superior technology, customer focus and capital strength.
Figure 3 and Figure 4 below disaggregate the same five metrics for PSBs and private-sector banks.

Figure 3: Ratio of key parameters to average assets of PSBs, 2001-2024. Source: RBI, authors' computations.
Public-sector banks
The parameters for PSBs broadly mirror the system-wide trends – unsurprising given their historical weight. Both NIMs and operating costs stabilised after 2010, though at lower levels than the overall system. NIMs fell from around 3% in 2001 to a band of 2.1-2.7%, averaging roughly 2.5%. Since 2021, margins have edged up as PSBs followed private peers into retail lending.
Operating costs declined sharply in the early 2000s, from around 3% of assets to 1.6% by 2010, largely due to IT adoption following a landmark agreement with employee unions in the late 1990s. Thereafter, the ratio plateaued around 1.7%, rising slightly after the pandemic.
The mid-2010s proved brutal for PSBs. The corporate bad-loan crisis triggered a wave of write-offs and provisioning, peaking at 3% of assets in 2018. RoA, which had averaged 1% for years, turned negative in 2018 and 2019, recovering only by 2024 to its historical norm.
The episode revealed both the fragility of PSB balance sheets and the fiscal implications of their ownership. The government had to inject substantial capital to restore solvency, absorbing much of the loss that would otherwise have fallen on private shareholders.
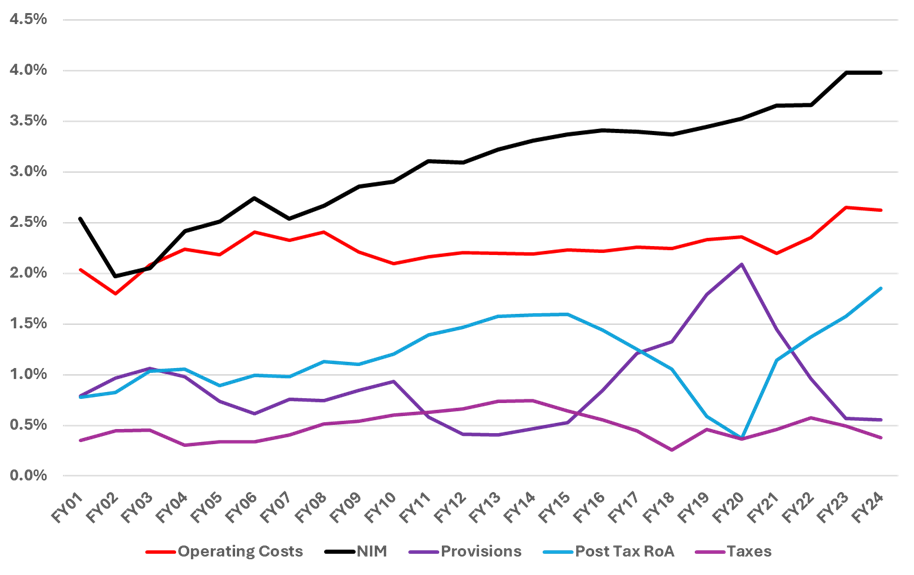
Figure 4: Ratio of key parameters to average assets of private-sector banks, 2001-2024. Source: RBI, authors' computations.
Private-sector banks
The trajectory of private banks could not be more different. In the early 2000s, their NIMs were roughly at par with PSBs, around 2.5%. Thereafter, they rose steadily, reaching almost 4% by 2024. The expansion reflects a strategic shift towards high-yield retail lending, credit cards and small-business financing – segments largely underserved by PSBs.
Operating costs for private banks have shown remarkable stability, averaging 2.2% of assets across the entire period. Unlike PSBs, they did not experience a dramatic early decline, having started from a more efficient technological base.
However, despite rapidly rising and a much higher share of consumer lending in their business mix compared to their public sector peers, which has structurally higher operating costs than commercial lending, these banks’ cost levels seem to be modestly higher.
In recent years, however, their cost ratios have inched up as they invest heavily in data analytics, artificial intelligence and digital channels – expenditures that have yet to translate into measurable productivity gains.
Private banks weathered the credit cycle far better. Their peak provisioning level, at 2% of assets in 2019, was significantly lower than that of PSBs. Consequently, their RoA dipped but never turned negative, indicating more resilient profitability and superior risk management.
A quarter century without productivity gains
Taken together, these metrics paint a sobering picture. Over 25 years, Indian banking has expanded exponentially in size, adopted new technologies and witnessed intense competition – yet its underlying efficiency and value distribution have barely evolved.
The persistence of high NIMs and operating costs suggests that productivity gains have not been passed on to customers in the form of lower intermediation spreads. Instead, the benefits of growth have been absorbed by employees, vendors and – in years of stability – by shareholders.
The credit risk cycle remains the system’s Achilles’ heel. Every few years, poor underwriting, concentration risks or economic downturns trigger a surge in provisions that wipes out years of accumulated profits. In those episodes, the costs fall squarely on shareholders – and, in the case of PSBs, on taxpayers.
Meanwhile, employees and vendors have enjoyed the most consistent extraction of value. Their share of assets, measured by operating costs, has remained the most stable and among the highest globally. In effect, the human and operational supply chain of Indian banking has been the most reliable beneficiary of its vast expansion.
The broader implications
The analysis raises several broader questions about the structure and policy design of Indian banking.
First, competition has not delivered consumer benefit. Despite new entrants, digitalisation and policy reforms, spreads have remained stubbornly high. This could reflect regulatory barriers, the dominance of large incumbents or the absence of price-based competition in retail markets.
Second, scale has not yielded efficiency. The lack of declining cost ratios implies that organisational complexity, regulatory compliance and technology spending have offset any gains from size.
Third, risk remains asymmetrically distributed. The state, as both owner and regulator, shoulders disproportionate losses while private actors enjoy relatively stable returns.
Finally, the fiscal dimension – through SLR and recapitalisations – blurs the boundary between public finance and banking stability. The government effectively subsidises the system’s resilience while extracting steady tax and funding benefits.
Conclusion
In summary, a quarter century of data reveals a paradox. India’s banking system has grown, modernised and diversified – yet its fundamental economics remain frozen. Margins are sticky, costs are rigid and risk continues to be socialised. The system seems to be stuck in a stable but low-quality equilibrium.
The true winners of this equilibrium appear to be employees and service providers, whose claims on banking assets have been the most reliable and least volatile. The losers, recurrently, are the shareholders – and by extension, the Indian state.
For policymakers, regulators and bankers alike, this should serve as a reminder: scale and technology alone do not guarantee efficiency. Unless competition translates into lower margins, and risk management into stable profitability, the returns to stakeholders in Indian banking will remain as they have for the past 25 years – unevenly shared and structurally inert.
Notes
1. Data for cross-country comparison have been sourced from the Bank of International Settlements.
2. Standard deviation is a measure used to quantify the amount of variation or dispersion of a set of values from the mean (average) value of that set.
Amrita Agarwal is an adviser and researcher. Harsh Vardhan is a management consultant and researcher. The views expressed in this post are solely those of the authors and do not necessarily reflect those of the I4I Editorial Board.
This article first appeared on Ideas for India. Read the original here.
This article went live on November nineteenth, two thousand twenty five, at thirty-seven minutes past two in the afternoon.The Wire is now on WhatsApp. Follow our channel for sharp analysis and opinions on the latest developments.


