
India's GDP 'Milestone': Five Ways the Typical Indian Experience Differs From the Grand Narrative
India is poised for an economic milestone – becoming the world's fourth-largest economy, projected to soon surpass Japan. Recent International Monetary Fund (IMF) figures estimate India's GDP for the 2024-25 fiscal year at approximately $3.9 trillion, a mere whisper away from Japan's $4.06 trillion (calendar year 2024).
While the official change in rankings might still be a year out, most of the overenthusiastic mainstream media have already declared the inevitable.
Nonetheless, a nation's economic story is rarely captured by its headline GDP alone. When we speak of a nearly $4 trillion economy, what does this colossal figure truly mean for the average Indian? Peeling back the layers reveals several realities that paint a more nuanced, and often starker, picture than aggregate numbers suggest.
Here are five key insights into why the "typical" (not average, mind you!) experience in India's booming economy might differ significantly from the grand narrative.
The 'average' Indian's share of the economy is often a statistical mirage
Divide India's ~$3.9 trillion economy by its ~1.4 billion people, and you arrive at a per capita GDP of roughly $2,711. This, in theory, is the "average" slice of the national economic cake each person would receive if distributed perfectly equally. But averages, particularly in economics, can be profoundly misleading.
Consider a room with ten people: nine possess Rs 100 each, while one individual holds Rs 9,100. The average wealth per person calculates to Rs 1,000, yet this figure reflects almost no one's actual financial situation. The single wealthy individual dramatically skews the average.
In economics, the "median" – representing the person in the exact middle if everyone were lined up by wealth – often provides a truer depiction of the “typical” experience. In nations with high inequality, like India, the median income or wealth is invariably much lower than the mean (the statistical average).
A vast mountain of national wealth is highly concentrated at the very top
The primary reason the "average" is so deceptive in India is the extreme concentration of wealth. Statistics from Oxfam India's 2023 report, 'Survival of the Richest: The India Story,' is telling: the wealthiest 1% of Indians now possess over 40.5% of the nation's total wealth.
Expanding this to the top 10%, this cohort commands more than 72% of national wealth. Conversely, the bottom 50% of the population – a staggering 700 million people – collectively own a mere 3%.
This isn't a static picture. The number of Indian billionaires, for instance, surged from 102 in 2020 to 166 in 2022, with the fortunes of some individuals multiplying several times over, particularly during the pandemic.
As financial expert V Raghunanthan noted in the Deccan Herald, the combined wealth of just two of India’s wealthiest individuals, Ambani and Adani (around $200 billion at the time of his writing), illustrates this distortion.
Using slightly different aggregate figures, he demonstrated that notionally removing the wealth held by just the top 5% from the national total would cause the recalculated average per capita figure for the remaining 95% of the population to plummet dramatically – in his illustrative example, from a hypothetical $2,800 to around $1,130.
This vividly underscores how concentrated wealth warps the "typical" economic reality.
India is a nation of multiple consumer realities, often described as "India1" versus the rest
To understand consumption patterns and true economic access, reports like Blume Ventures' 'Indus Valley Annual Report 2025' offer a useful segmentation of the Indian populace:
India1: Comprising roughly the top 10-15% of the population, this segment wields significant discretionary spending power, with consumption patterns resembling those of a middle-income country.
India2: The aspirational next ~20-25%.
India3: The vast majority, whose spending is largely confined to non-discretionary essentials.
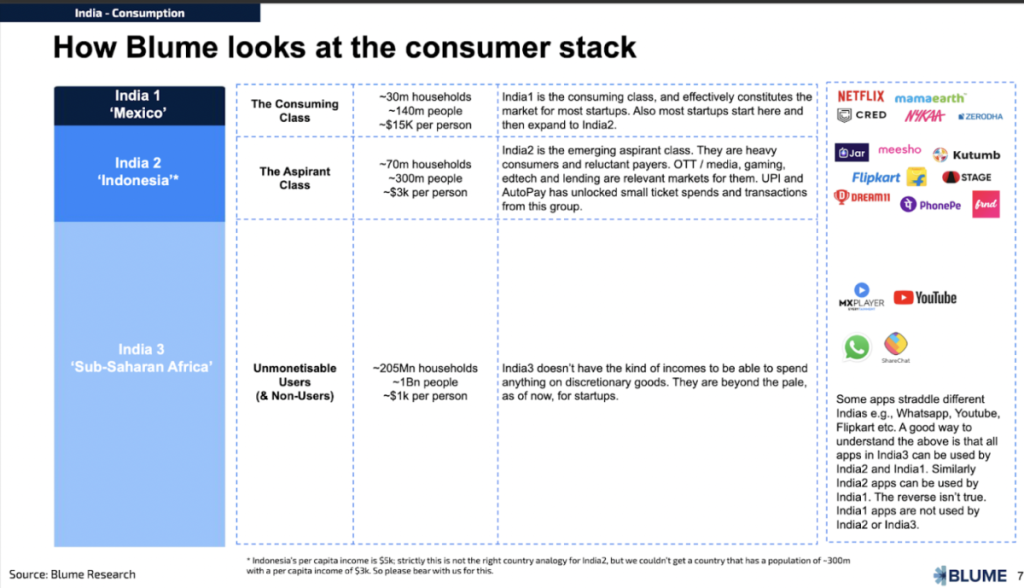
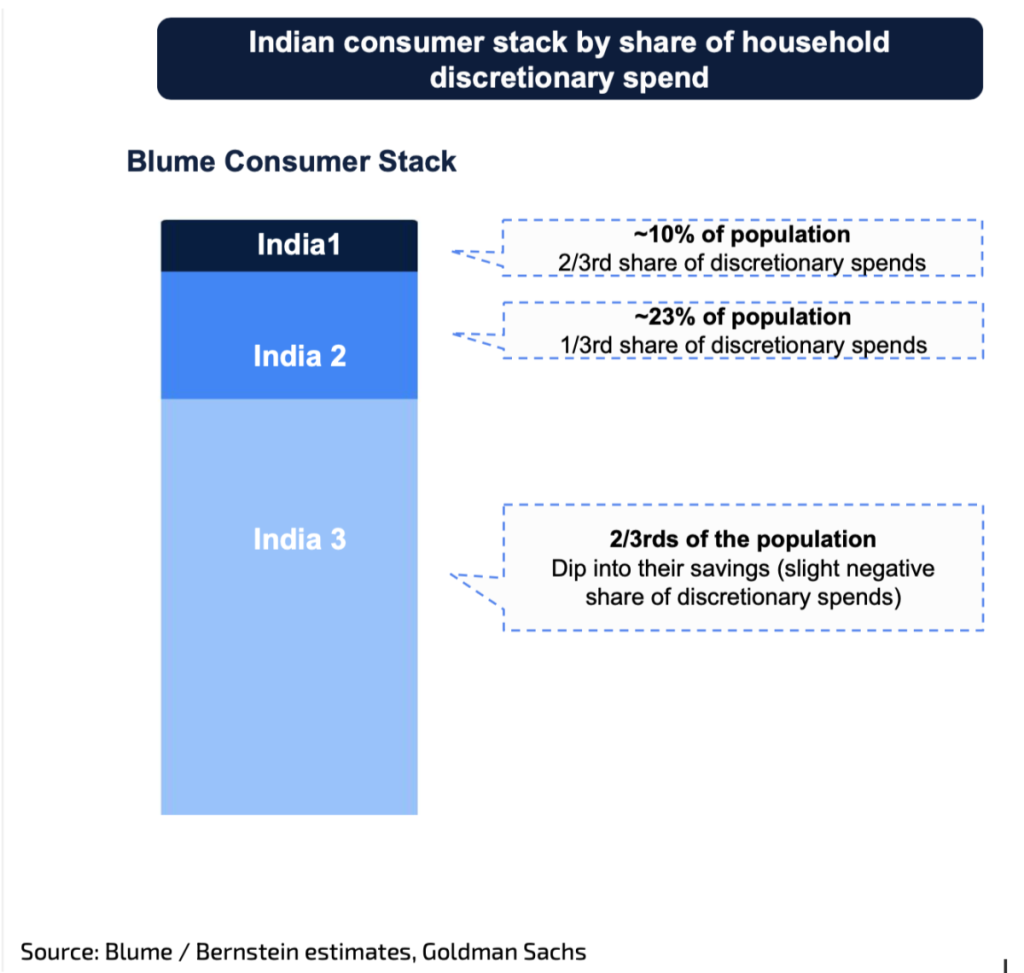
The Blume report (page 78) points out that "India1," despite being a relatively small fraction of the population, drives approximately two-thirds of all discretionary spending. This means much of the visible economic dynamism – from high-end consumption to investment in new ventures – is powered by this elite segment.
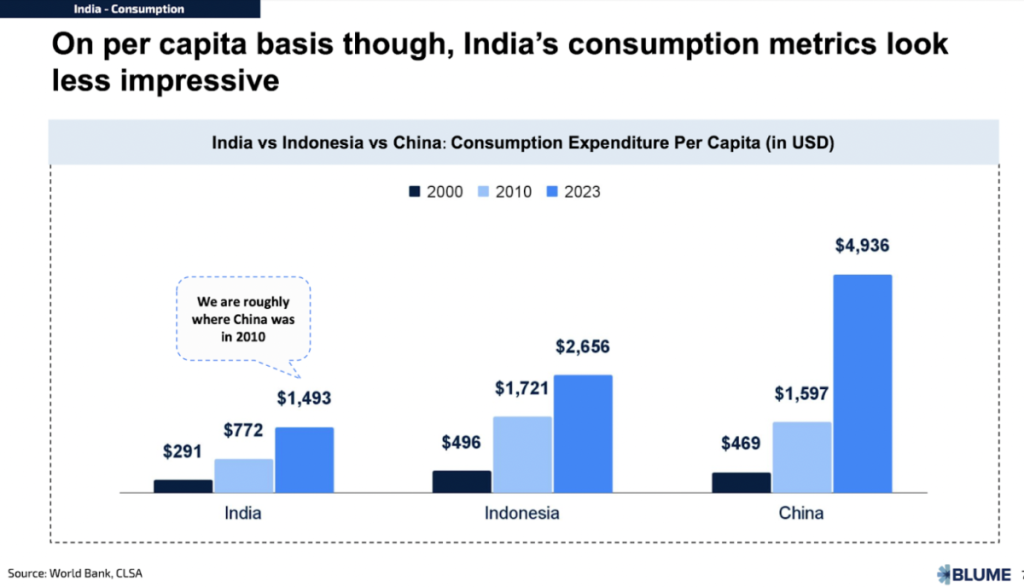
While India's overall per capita consumption expenditure is growing, the same report (page 71) shows it still lags significantly, positioning India where China was in 2010. This indicates that the benefits of economic growth are not yet broadly elevating mass consumption to substantially higher levels.
The taxes we all pay, especially indirect ones, create an uneven burden
Beyond income and wealth, the structure of taxation also reveals underlying disparities. While direct taxes target income, indirect taxes – such as India's Goods and Services Tax (GST) levied on everyday items – are paid by everyone, irrespective of their earnings.
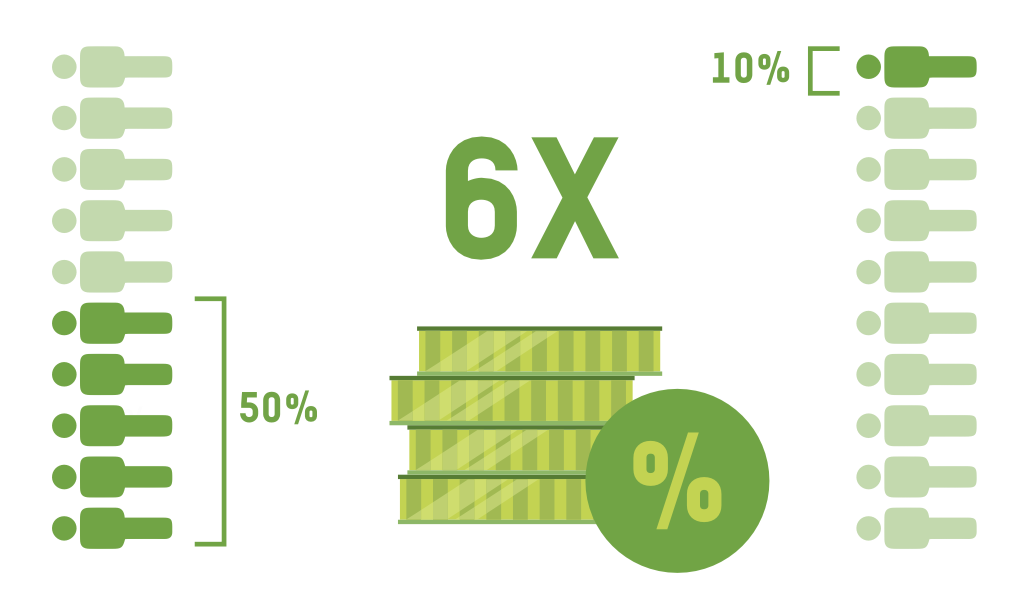
Oxfam’s research indicates a regressive impact: the bottom 50% of Indians end up paying six times more in these indirect taxes as a proportion of their income compared to the richest 10%.
Indeed, an estimated 64% of total GST revenue in India is drawn from the consumption of this less affluent bottom half. This reliance on consumption taxes, particularly at a time when corporate tax rates have seen reductions, places a disproportionate fiscal burden on those with the least capacity to pay.
The economy shows diverging paths, with corporate windfalls often contrasting with a squeeze on household finances
Perhaps one of the most striking indicators of this uneven economic experience comes from comparing corporate performance with household finances. The Oxfam report highlights a stark divergence in the financial year 2021-22: while corporate profits in India reportedly experienced a substantial 70% surge, an astonishing 84% of Indian households saw a decline in their income.
This chasm means broad economic recovery or growth in specific sectors does not automatically translate into improved financial well-being for the majority of families. The "India1" segment, as suggested by the Blume report, may be driving high-value consumption, but this doesn't reflect the reality for the wider population.
Beyond the numbers
These five realities paint a picture where extreme inequality profoundly shapes the lived experience of India's economic ascent. This isn't merely an economic debate; it carries profound human costs. Oxfam links these disparities to critical issues such as poor nutrition (with an estimated 1.7 million deaths annually in India attributed to diseases from poor diet) and unequal access to healthcare and education.
However, a growing economy inherently offers more resources. The challenge, and indeed the opportunity, lies in ensuring these resources are channelled towards more inclusive development. The potential for change through more equitable policies is significant. For instance, Oxfam calculates that:
- A modest three percent wealth tax on the total wealth of Indian billionaires could fund the National Health Mission (current allocation: Rs 37,800 crores) for five years.
- Taxing all of India’s billionaires at 2% would support the nutritional requirements (Rs 42,033 crores) of the country's malnourished for three years.
- A 1% tax on the 10 wealthiest billionaires would be enough to cover the Rs 21,202 crore shortfall in the Samagra Shiksha education fund (FY23 BE vs. FY22 ME ask) for 1.3 years.
- Taxing the wealthiest 100 Indian billionaires at two percent could cover the Rs 31,151 crore cost of providing breakfast in government schools for nearly 3.5 years.
As India strides confidently towards becoming one of the world's top economic powerhouses, its burgeoning GDP is just a partial testament to its potential. But the true measure of its success will ultimately lie not just in the aggregate size of its economy, but in how equitably its benefits are shared.
Understanding the divergent realities of "India1," "India2," and "India3," and actively addressing the deep-seated inequalities will be crucial for ensuring that India's growth story is one where everyone genuinely gets a meaningful slice of the expanding economic cake.
This article went live on May twenty-sixth, two thousand twenty five, at forty-nine minutes past two in the afternoon.The Wire is now on WhatsApp. Follow our channel for sharp analysis and opinions on the latest developments.


