
Mainstream Interpretation of India’s GDP Growth Data Misses the Woods for the Trees
As per the most recent quarterly growth figures for the October-December 2022 period, India’s GDP growth is 4.4% in real terms (when adjusted for inflation) and 11% in nominal terms (down from 6.3% real growth seen in July-September period), which appears to be back to pre-COVID-19 levels.
While some economists see the quarterly growth slowdown to be shaped by “past revisions” done in growth data and a base effect causing the growth numbers to appear on the lower side, overall, a 4.4% headline growth number is hardly a good sign while evaluating the state of the Indian economy.
In terms of growth composition, overall output numbers for the same period (11.6% at the end of December) show signs of marginal improvement (compared to 9.4% seen in September), and services continued to outpace manufacturing activity. However, private consumption and macro-private investment growth still appears to be weak.
As argued before, while reviewing the macro-elements and components of growth, in any statistical interpretation exercise, it’s difficult to get the full picture one needs. For example, keeping aside the base effect, the fact that private consumption demand is still woefully low (say, rising only 2.1% in the last quarter, compared to 8.8% of the second quarter) indicates how much of the low-middle-income and middle-income class in India is consuming less and its demand remains compressed.
What’s vital, while analysing the current numbers, is to not just be swayed by the interpretative meaning of recent trends, or take a short-term view of the numbers, but rather view India’s growth composition, its pattern, in context of a broad-based historical fact.
For one, the weakness of the manufacturing sector (discussed at length here) isn’t part of some new trend but is reflected in the historical pattern of Indian growth’s sectoral composition and in its employment pattern too.
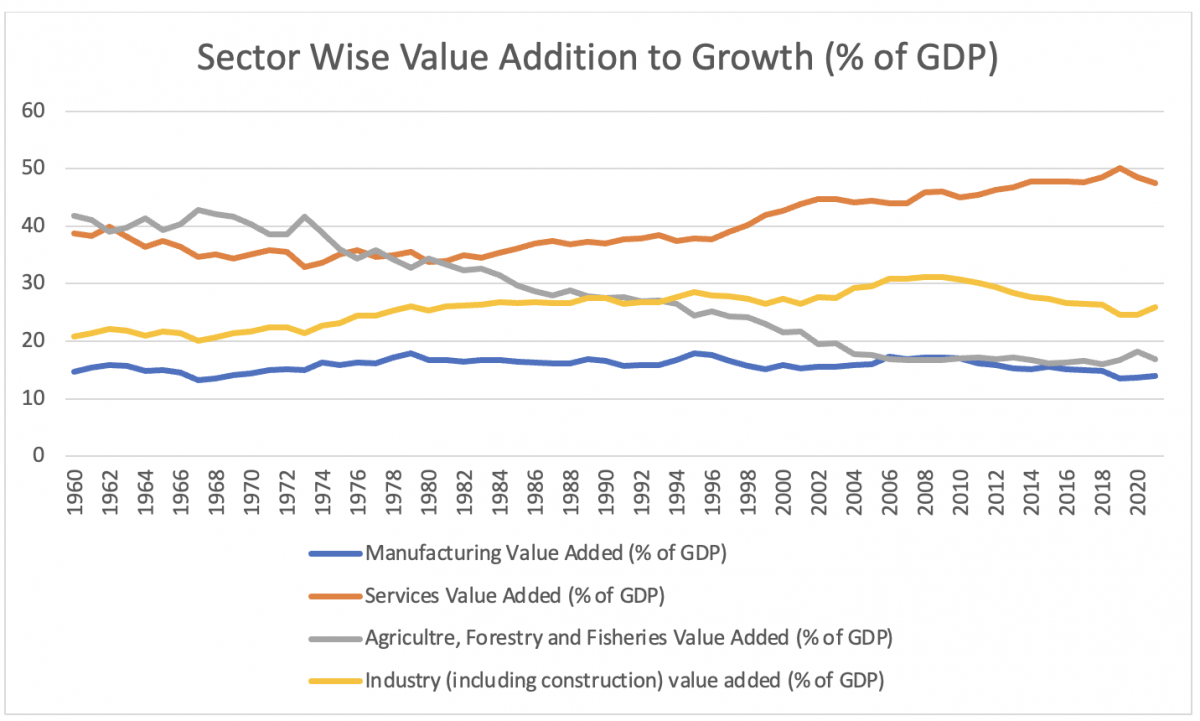
Source: Author’s calculations from World Bank Database
In terms of sector-wise value addition to growth (as percentage of GDP), India’s manufacturing sector has almost remained at the same level since the 1960s (I explained some of the reasons behind this here).
Industry (including construction) added more to the Indian GDP since the post mid-1970s but at an incremental rate – as workers from rural areas left agriculture and migrated to cities for work. Agriculture, forestry and fisheries sector waned in terms of their value addition to GDP (despite having most of India’s rural population employed by this one sector).
Service, on the other hand, with its rising value addition to GDP growth, particularly post mid 1990s, became part of India’s urban growth narrative. But there’s a twist to this.
Why India’s growth has historically remained exclusionary
According to development economist Ajit Ghose’s seminal work, and recent 2023 paper, a closer look at India’s growth-employment data indicates how since the early 1990s, India’s economy experienced a pattern of exclusive growth, that is, a kind of growth that benefited the urban rich. The richest 10% of the population has been the recipient of a large and growing share of the incremental income generated by growth.
Based on the distribution of benefits of growth (in terms of income) amongst the percentage of population – as seen in the table below, sourced from Ghose’s paper – India’s national income quite clearly became increasingly concentrated in a thin layer of an already rich population in the post-1992 period.

Source: Ghose (2023)
Even the middle class failed to develop; persons or households commonly regarded as belonging to the middle class in India belong to the richest 10%.
Another trend of historical data that inter sectionally helps validate the exclusionary growth tale is by seeing what’s happened in India’s overall employment pattern.
According to Ghose, “Employment of the skilled—the rich—has been (still) growing while the low skilled—the poor—have suffered progressive exclusion from employment.” What emerges is that the source of exclusive growth lies in the nature and characteristics of the lead sectors, namely “skill-intensive services”.
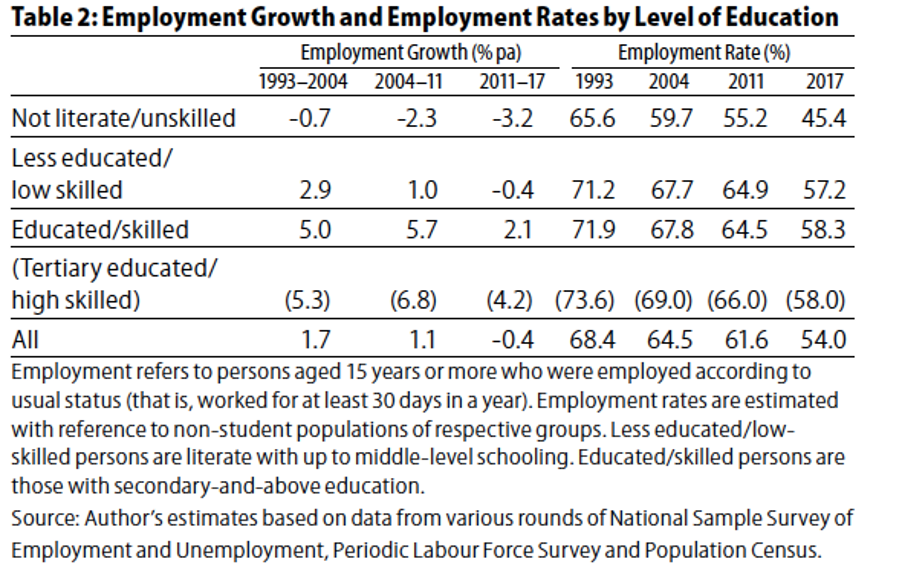
Source: Ghose (2023)
Overall employment growth, low to begin with (just 1.7% per annum during 1993–2004), decelerated rapidly after 2004 and turned negative after 2011. “The rapid deceleration was due, in large measure, to the progressive exclusion of unskilled and low-skilled workers from employment,” argues Ghose.
The employment of the unskilled declined at an increasing rate throughout 1993–2017 (as seen in table 2 above). The growth of employment of the low skilled was also decelerating rapidly and turned negative during 2011–17.
Remarkably, even the growth of employment of the skilled showed a sharp deceleration after 2011 (which is when the last census was conducted); while growth created jobs basically for the skilled, it did not create enough jobs even for them in this period.
Inter-sectional growth validation is critical for holistic assessment
What do we learn from the historical context on growth provided here?
First, it points at some of the key interpretative limitations of growth estimates, especially when quarterly figures come out and are read without context.
In economic analysis and debates, it is important to recognise that any critique of methodological frameworks – in statistical or non-statistical cases – broadly relies on two foundational elements: form and structure.
A form-based critique may often counter (or invalidate) the content of say a testable hypothesis or research question (in some cases a problem to deconstruct), while structure-based critiques seem to be mostly concerned with the selection of identified variables (say, either dependents or independents in a model), or on the nature of conclusive evidence drawn from pre-existing theoretical models.
In case of national income/growth accounting too – which is more of a statistical process of accounting – the form and the structure of analysis can be designed by a given analyser in the way(s) he wants.
In other words, selection of indicators used in studying GDP growth trends for a nation over a period of time can be picked to suit a given hypothesis and then validate it accordingly (for example, if I am convinced that India’s GDP numbers were ‘underestimated’ during a given time period and there is a base effect to explain all that’s wrong, I can pick only those industrial indicators where growth trends showed higher growth than other indicators over a period of time, and accordingly chose a base year that helps me come to the closest result possible, which is in alignment to the testable hypothesis, i.e., of GDP being ‘underestimated’).
Unless one looks at an underlying growth model and tries to support (or counter) it by further developing an alternative explanation to the research question, or looks at the numbers from a deeper, more historical context, any robust critique or statistical assessment may hardly take us to any objective certainty on what the actual trends are, or what they mean for measuring/evaluating the state of the economy (so, how we design and select indicators remain key to GDP diagnosis).
In recent decades, such ‘math’ heavy patterns followed in the economic analysis of growth and in shaping its discourse has been recognised as the mathiness problem, a term coined by Paul Romer, where, according to Romer, too much of mathematical miscellany (especially in form of statistical jugglery), crowds out actual research motives and fails to communicate ‘facts with more clarity’.
What GDP fails to measure and account for
In an essay written in 2017, I had discussed some of the fundamental limitations of the GDP as an indicator for growth measurement in the context of India and much of the unorganised-informal workforce driven developing world. It might be worth (re)plugging some of those arguments here.
GDP measures the total monetary value of final goods and services produced within the domestic territory of the country over a period of time. While significant methodological advancements have been made in GDP accounting at both the national and global level, one critical limitation of both GDP and GNP (Gross National Product) is that they only value outputs at market prices.
In a country like India, and elsewhere too, a majority of economic activities occur outside the market and the values of their outputs need to be somehow calculated. This is called the “imputed” value.
The above limitation can be explained with case illustrations like farmers involved in subsistence farming consuming the food they produce, where economists often fail to estimate the quantity of produce and impute market values to what such farmers produce but did not or could not sell in the market and consumed themselves; or for people who live in houses they own, where economists usually fail to impute the value of the “dwelling services” involved (if the house owners are paying the rents at market rates to themselves).
Moreover, all non-marketed transactions or output produced is missed out from the official GDP accounting process, whose value isn’t even imputed. A case in point can be made here to India’s massive informal sector, which was worst hit by the demonetisation drive, the hurried implementation of the GST and the curfew style lockdown.
Second, income measures like the GNP, accounting for incomes of all residents of a country living within or outside the country, fail to realistically represent living standards of people. An optimal standard of living is vital for measuring developmental progress. However, with GDP and GNP you can get a perspective on living standards only by accounting total and average monetary income (as done by per capita income).
Even if we attach a greater weight on the persistent, gradual rise in monetary income, for things that can even be bought with money, we often make poor decisions as consumers (assumed as “rational beings” who spend money to maximise their well-being). Even if we are totally rational as consumers, the existence of positional goods (a concept coined first by economist Fred Hirsch and explained as a good which is only valued by the possessor because it’s not possessed by others) in any country makes income an unreliable gauge of true living standard.
Positional goods are goods whose value derives from the fact that only a small proportion of potential consumers can have them. Which means to say, even if our income increases (with an 8% GDP growth rate), we may still be unable to acquire things like houses in prime locations, a good education or access to top jobs. This point is connected to explaining India’s overall slowing productivity rate, exacerbating skill gap and worsening employment scenario (discussed here).
Third, distribution of income amongst and within households or different economic classes in given societies is not captured by GDP data. For most studies measuring and accounting trends in income inequality, survey methods based on consumption spending and consumption behaviour are used and relied upon. Economists like Angus Deaton, Jean Dreze, Kaushik Basu and Ravi Kanbur have worked extensively on developing such metrics.
Fourth, one of the most important limitations of GDP is that much of the ‘work’ done by people today remains under-measured or largely unaccounted for.
Despite an overwhelming emphasis on it across social sciences, the value of work – a definitive condition of humanity in most of our history – is sporadically covered by modern economics as a subject beyond the income it generates from the hours recorded at work.
Methods in mainstream growth economics too fail to incorporate the effect of some of the techno-capitalistic advancements made, like the role of the internet, telecommunications and so on in shaping the productive capabilities of people in modern economies and the nature of work itself.
In conclusion, GDP calculations-much like most economic indicator based analysis work primarily on ‘estimates’ made with ‘extrapolations’ from growth-driving sectoral trends based on real-time trends. The real question is whether these ‘extrapolations’ end up reflecting India’s actual economic situation during a period of time. For this, a deeper, intersectional historical context is vital and fields of economic history, economic sociology and development economics have provided enough methods to stop obsessions with short-term trends that may do little to clarify, but may rather confuse.
Deepanshu Mohan is an associate professor of economics and director at the Centre for New Economics Studies at Jindal School of Liberal Arts and Humanities, OP Jindal Global.
This article went live on March third, two thousand twenty three, at fourteen minutes past twelve at noon.The Wire is now on WhatsApp. Follow our channel for sharp analysis and opinions on the latest developments.


