
Did Political Rallies Contribute to an Increase in COVID-19 Cases in India?
In the backdrop of the terrible human tragedy unfolding in India, a fierce debate is playing out in the media: Did political rallies contribute to the tsunami of COVID-19 cases that has overwhelmed the rickety healthcare system since the middle of April 2021?
The answer seems obvious. Large gatherings of people without masking and physical distancing, no matter the purpose of the gathering, can transmit the virus that causes COVID-19.
Political rallies in all the five states that witnessed assembly elections in the last few weeks were large gatherings of people. Newspaper reports and TV coverage of these rallies provide overwhelming visual evidence that masking and physical distancing were almost completely ignored. Therefore it seems extremely likely that these events contributed to the rapid transmission of the virus and the subsequent rise in the number of COVID-19 cases.
To test this hypothesis, I collected data on daily confirmed COVID-19 cases in the top 25 states in India which together account for more than 99 percent of the daily COVID-19 cases today. I divided these 25 states into two groups. The first group, which I call ‘Election States’, consists of the five states that went to the polls from late March: Assam, Kerala, Puducherry, Tamil Nadu and West Bengal. The second group consists of the other 20 states; I call this group the ‘Non-Election States’.
Also read: What the SOS Tweets Tell us About the Second Wave of COVID-19
In Figure 1, I plot the logarithm of the average number of daily COVID-19 cases in the two groups of states from January 1, 2021 to April, 29 2021. The slope of the logarithmic plot provides visual information about the growth rate of the average number of daily COVID-19 cases. When the curve is downward sloping, it means that the daily number of confirmed cases is declining over time; when the curve is upward sloping, that shows that the daily number of confirmed cases is rising over time. The steeper the curve, the more rapid the growth rate of the daily number of confirmed cases.
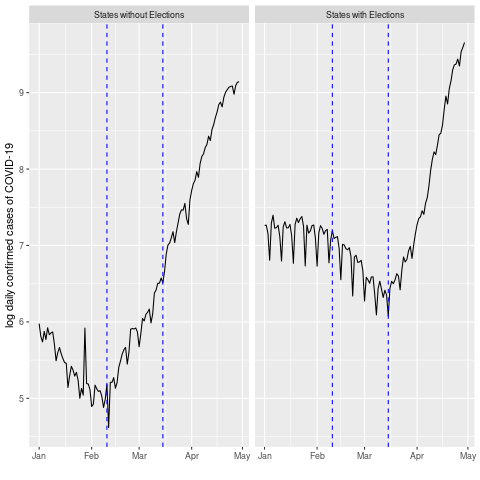
Figure 1. The black solid line in this chart is the logarithm of average daily confirmed cases of COVID-19 in two groups of states between 1st January 2021 and 29th April 2021. The vertical blue dashed lines are drawn to point to two dates, 10th February and 15th March. Source: Chart created by author using data from https://www.covid19india.org/
From Figure 1, we see that the average number of daily COVID-19 cases was declining in both groups of states in the early part of the year. The logarithm of the average number of daily COVID-19 cases was on a downward trajectory in January and February in both groups of states. This is what lulled the Narendra Modi government and its supporters into the belief that India was past the pandemic, that India had developed herd immunity.
From mid-February, we start seeing differences emerge in the trajectory of the COVID-19 outbreak in the two groups of states.
The downward trajectory of daily COVID-19 cases is reversed in the Non-Election States on February 10. Since then, the average number of COVID-19 cases has been rapidly rising in the Non-Election States. This reversal was most likely caused by the incorporation of new variants of the virus into the Indian population and the letting down of the guard related to masking and physical distancing in states like Maharashtra, Karnataka and Gujarat.
What is interesting and worth noting is that between February 10 and March 15, i.e. for more than a month, the average number of daily COVID-19 cases continued declining in the Election States even as it was rising in the Non-Election States. It is only from March 15 that the average number of COVID-19 cases in the Election States starts its rapid upward trajectory.
Watch: 'Mid-May COVID Surge Could See 5-6 Lakh Cases a Day, 7,000 Daily Deaths': Gautam Menon
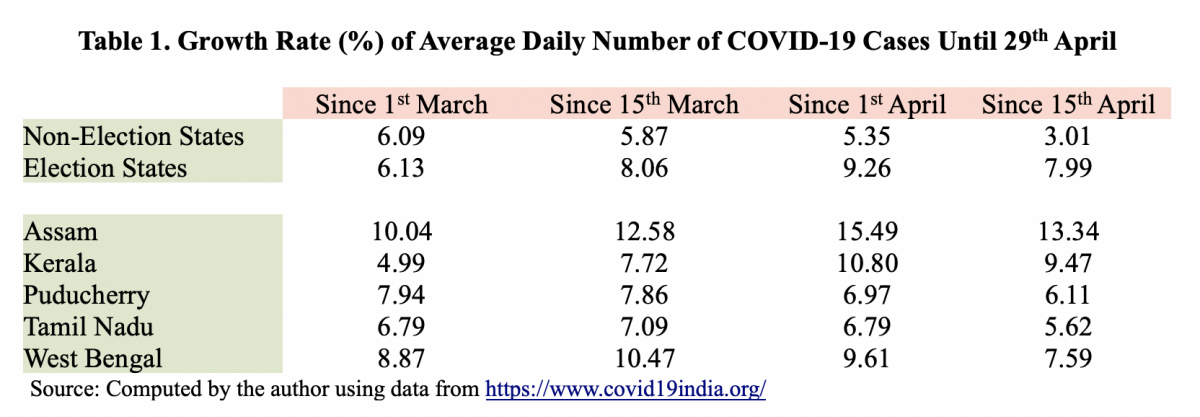
Once the surge of cases emerged in the Election States, it quickly overtook the average number in the Non-Election States. The first two rows of Table 1 presents the growth rate of the average number of daily COVID-19 cases in the two groups of states for four, increasingly recent, time periods: March 1 to April 29, March 15 to April 29, April 1 to April 29, and April 15 to April 29. From the numbers in Table 1, we can see growth rates diverging in the two groups of states from early March. Even as the growth rate was slowly declining in Non-Election States, from 6.09 to 5.87 to 5.35 to 3.01, it was rising in the Election States, from 6.13 to 8.06 to 9.26, before dipping a little since April 15 to 7.99. The divergent growth rates then led to a divergence in the level of average cases. By mid-April the average number of daily cases in Election States had overtaken the corresponding number in the Non-Election States (see Figure 1). Thankfully, the growth rate has started declining in recent days in Election States.
The difference in the trajectories of the COVID-19 outbreak in the Election and Non-Election States lines up with the timing of the election process and provides evidence that election rallies contributed, at least in part, to the rapid rise in cases in many states in India.
The Election Commission of India started the process of notification of assembly elections in Assam, Kerala, Puducherry, Tamil Nadu and West Bengal in early March (on March 2 in West Bengal and Assam, and on March 12 in Kerala, Tamil Nadu and Puducherry).
By mid-March, election campaigning had kicked off in real earnest in all these states. Almost on a daily basis, these states now witnessed large gatherings of people in election rallies, without masks and without social distancing. This created a fertile ground for the rapid transmission of the virus across a wide section of the population. The trajectory of COVID-19 cases in these states reversed – from declining trajectories, we see rising trajectories since early March. As the election rallies continued, the growth rate of average daily cases accelerated. The result is the explosion of cases that has overwhelmed the healthcare system.
There are differences across the five Election States, as can be seen from the bottom panel of Table 1. The worst performer is Assam, where the growth rate surged from 10% to over 15.5%, before declining to 13.34%. West Bengal and Kerala are the next worst performers. Both Puducherry and Tamil Nadu manage to contain the spread much better than the other three states. Tamil Nadu is clearly the best performer, where the growth rate barely went above 7%.
The only sliver of positive news is that the growth rate of daily confirmed cases has started declining in all the Election States (as can be seen from the last column in Table 1). This is likely the result of the election process winding down across the five states and the welcome, if belated, response by political and administrative leaders to the dangers of mass gatherings in the context of the pandemic. But this only further reinforces the basic hypothesis that election rallies contributed to the surge of COVID-19 cases in India and visited this enormous tragedy on the people of the country.
If our political administrative leaders had even an iota of concern for the common people, then public health measures would have been more strictly enforced during election rallies and other mass gatherings and this man made tragedy of enormous proportions could have been avoided.
Deepankar Basu is Associate Professor in the Department of Economics at the University of Massachusetts Amherst.
This article went live on May second, two thousand twenty one, at twenty-eight minutes past nine in the morning.The Wire is now on WhatsApp. Follow our channel for sharp analysis and opinions on the latest developments.


