
How Did Electors in the 121 Bihar Seats Polling Today Vote in 2020?
Voters in 121 Bihar constituencies headed to the polls today, November 6, for the first phase of the Assembly elections in the state. While the voter turnout till 5pm was recorded at 60.13%, a look back at the 2020 election results provides the essential context for this contest.
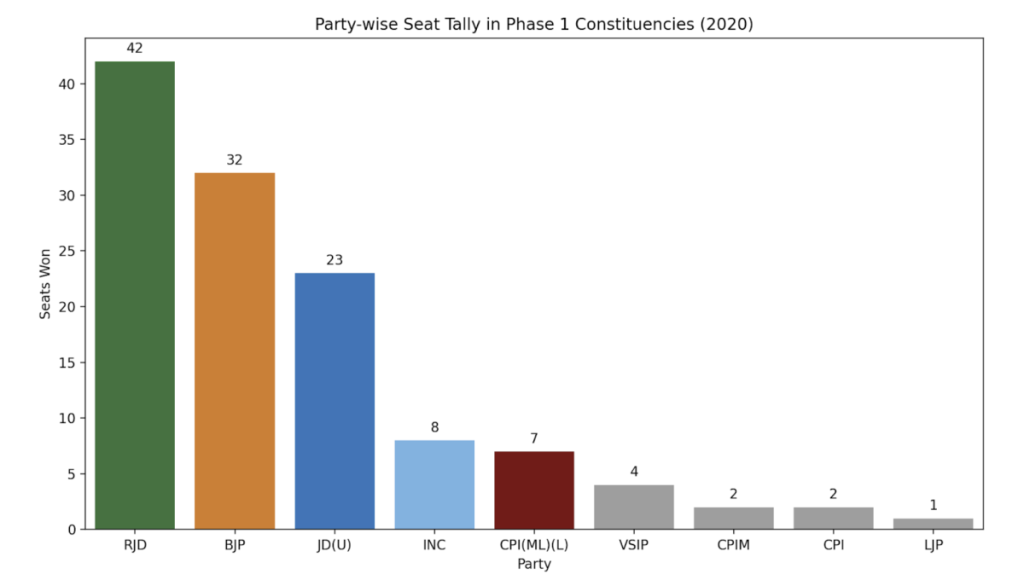
The party-wise seat tally in 2020, shows that the contest between the two major alliances was extremely close, with the mahathagathbandhan (MGB) or grand alliance winning 61 seats and the National Democratic Alliance (NDA) winning 59 seats. One seat was won by another party.
Individual party performances established a clear hierarchy. The Rashtriya Janata Dal (RJD) was the single largest party with 42 seats. The Bharatiya Janata Party (BJP) was second with 32 seats. The Janata Dal (United) finished third with 23 seats. The remaining seats were won by the Congress (INC) with 8, CPI(ML)(L) with 7, Vikassheel Insaan Party (VSIP) with 4, CPIM with 2, CPI with 2, and the Lok Janshakti Party (LJP) with 1.
In the following figure, the strike rate measures a party's ability to convert a contested seat into a victory. The data shows a significant performance gap.

The BJP was the most effective, winning 32 of the 50 seats it contested (64.0%). The RJD followed with a strong performance, winning 42 of 71 seats (59.2%). The CPI(ML)(L) also proved highly efficient, winning 7 of 14 seats (50.0%). In contrast, the JD(U) struggled, winning only 23 of 64 seats (35.9%). The Congress (INC) had the lowest strike rate among major parties, winning just 8 of 30 seats (26.7%).
Vote-to-seat conversion efficiency is the total number of votes a party needed to win one seat, where a lower number indicates higher efficiency.
The smaller parties were the most efficient, with CPIM needing 96,872 votes per seat and VSIP needing 105,368. Among the major parties, the BJP was more efficient than the RJD, requiring 111,732 votes for each seat compared to the RJD's 117,093. The inefficiency of other parties was stark: the JD(U) required 154,400 votes per seat, and the INC needed 198,941. The LJP, needing 1,381,677 votes for its single victory, was numerically proven to be a spoiler.
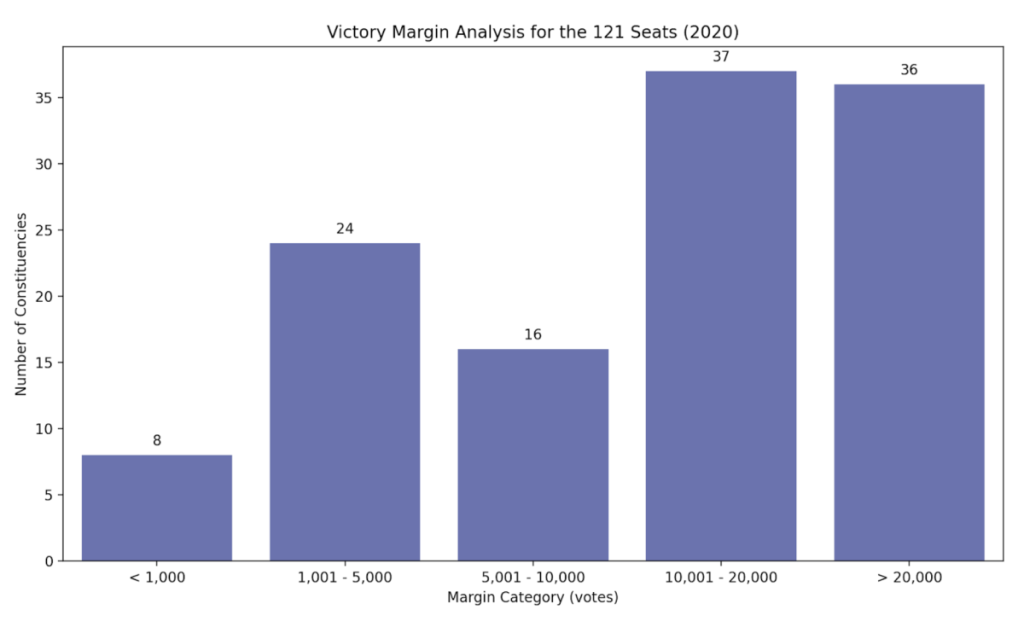
In an overall marginal analysis, the distribution of victory margins reveals the competitive nature of the election. The 121 seats were decided across the following bands:
In total, 32 constituencies were decided by a margin of 5,000 votes or less, making them the most volatile.
So, who won the close fights?
A breakdown of the 32 "small-margin" seats (margins ≤ 5,000 votes) shows which parties were most successful in these contests. The RJD won 9 such seats. The JD(U) won 8, the BJP won 7, the INC won 5, and the VSIP, LJP, and CPI each won 1 of these tight races.
Finally, a detailed breakdown of each party's wins across the five margin bands, reveals their distinct electoral character.
| Party | < 1,000 | 1,001-5,000 | 5,001-10,000 | 10,001-20,000 | > 20,000 | Total Wins |
| RJD | 1 | 8 | 7 | 12 | 14 | 42 |
| BJP | 1 | 6 | 2 | 13 | 10 | 32 |
| JD(U) | 4 | 4 | 5 | 7 | 3 | 23 |
| INC | 0 | 5 | 1 | 0 | 2 | 8 |
| CPI(ML)L | 0 | 0 | 0 | 3 | 4 | 7 |
| VSIP | 0 | 1 | 1 | 2 | 0 | 4 |
| CPIM | 0 | 0 | 0 | 0 | 2 | 2 |
| CPI | 1 | 0 | 0 | 0 | 1 | 2 |
| LJP | 1 | 0 | 0 | 0 | 0 | 1 |
This data shows the RJD and BJP built their tallies on decisive, large-margin victories, while the JD(U)'s survival was heavily dependent on its 8 wins in the highly vulnerable, sub-5,000 vote margin category. The Left parties' victories were almost exclusively in the high-margin categories, pointing to deep, concentrated support in specific geographic pockets.
This story was updated with the voter turnout as of 5 pm on November 6.
This article went live on November sixth, two thousand twenty five, at twelve minutes past six in the evening.The Wire is now on WhatsApp. Follow our channel for sharp analysis and opinions on the latest developments.


