
Does the World Really Need to Brace for ‘China Shock 2.0’?
In 2016, US economists Autor, Dorn, and Hanson coined the term “China Shock” to describe the impact on employment in the US manufacturing sector of rising imports from China during the 1990s and the 2000s. Recently, renewed attention has been focused on China’s surging exports, the anticipated impact of which is being described by the facile term China Shock 2.0.
The official US view was clearly stated by then Treasury Secretary Janet Yellen during her April 2024 visit to China:
China is now simply too large for the rest of the world to absorb this enormous capacity. Actions taken by the PRC today can shift world prices. And when the global market is flooded by artificially cheap Chinese products, the viability of American and other foreign firms is put into question.
We’ve seen this story before. Over a decade ago, massive PRC government support led to below-cost Chinese steel that flooded the global market and decimated industries across the world and in the United States.
The concerns are not limited to the US alone. China’s trade with the European Union (EU) has followed a very similar pattern, prompting unusually blunt articulations such as this:
China is simultaneously a partner, a competitor, and a systemic rival. … Our economic relationship is critically unbalanced, both in terms of trade flows and of investment, due to a significant asymmetry in our respective market openings.
Economic policy, as well as academic thought and analyst commentary in the US has generally favoured free trade and globalisation, but over the last few years, trade barriers and protectionism have increasingly found favour, especially since manufacturing job losses have been concentrated in politically crucial states. It is thus worth asking if concerns about China are valid or if they are overstated.
In the last few years, China has become a manufacturing behemoth. In terms of value added in manufacturing, we can see China overtaking the US and EU beginning in 2010. The gap has only widened since then. By 2023, China’s share of world manufacturing value added was nearly 29%, way ahead of the next largest manufacturer, the United States. The other top 10 manufacturing economies of the world lag far behind. China manufactures nearly six times as much as either Japan or Germany and ten times as much as India or South Korea. Indeed, its share in world manufacturing is larger than the combined shares of eight of the top 10 manufacturing countries.
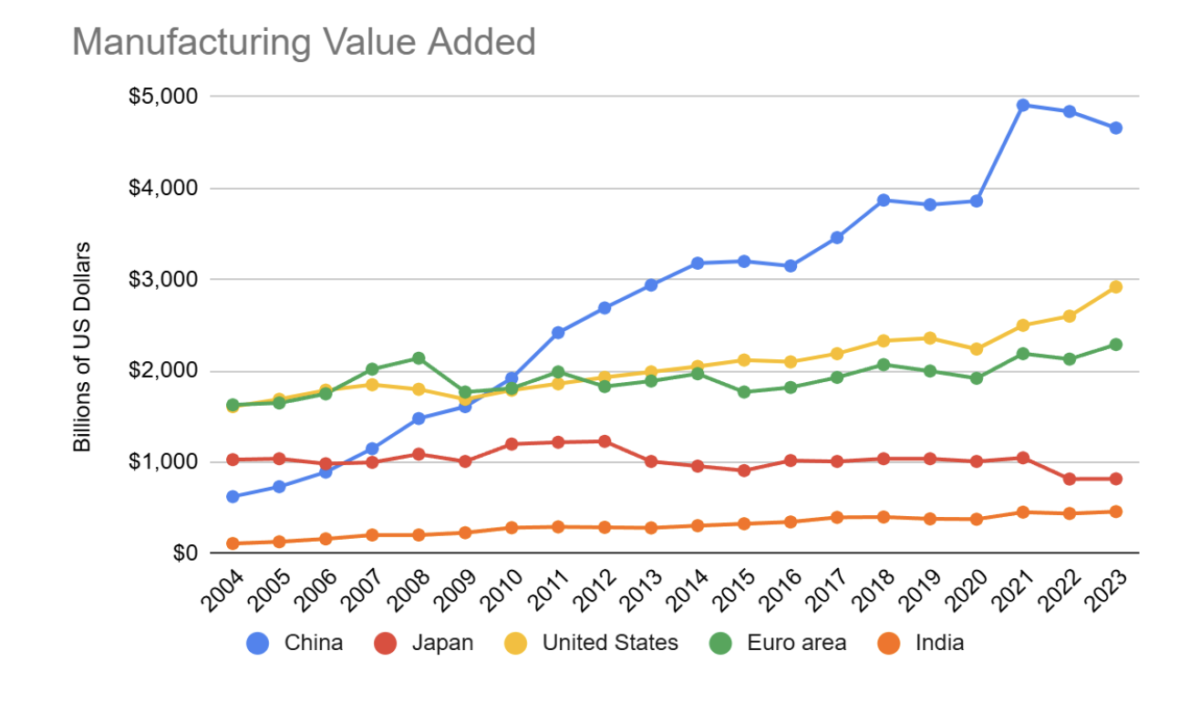
Source: World Bank, U.S. Bureau of Economic Analysis. Value added for Japan in 2023 estimated using 2022 share of GDP and 2023 GDP.
| Country | 2023 Manufacturing Value Added (trillions of US Dollars) | Share of World Manufacturing Value Added |
| China | 4.66 | 28.8% |
| United States | 2.92 | 18.0% |
| Germany | 0.84 | 5.2% |
| Japan | 0.82 | 5.1% |
| India | 0.46 | 2.8% |
| South Korea | 0.42 | 2.6% |
| Mexico | 0.36 | 2.2% |
| Italy | 0.35 | 2.2% |
| France | 0.29 | 1.8% |
| Brazil | 0.29 | 1.8% |
| World Total | 16.18 |
Source: World Bank, U.S. Bureau of Economic Analysis. Value added for Japan in 2023 estimated using 2022 share of GDP and 2023 GDP.
This manufacturing prowess is clearly reflected in export performance. After China joined the World Trade Organization (WTO) in December 2001, its trade balance with the rest of the world grew from $30 billion in 2002 to an astonishing $838 billion by 2022. The balance for 2024, reported by China’s General Administration of Customs, is even higher, at $983 billion.
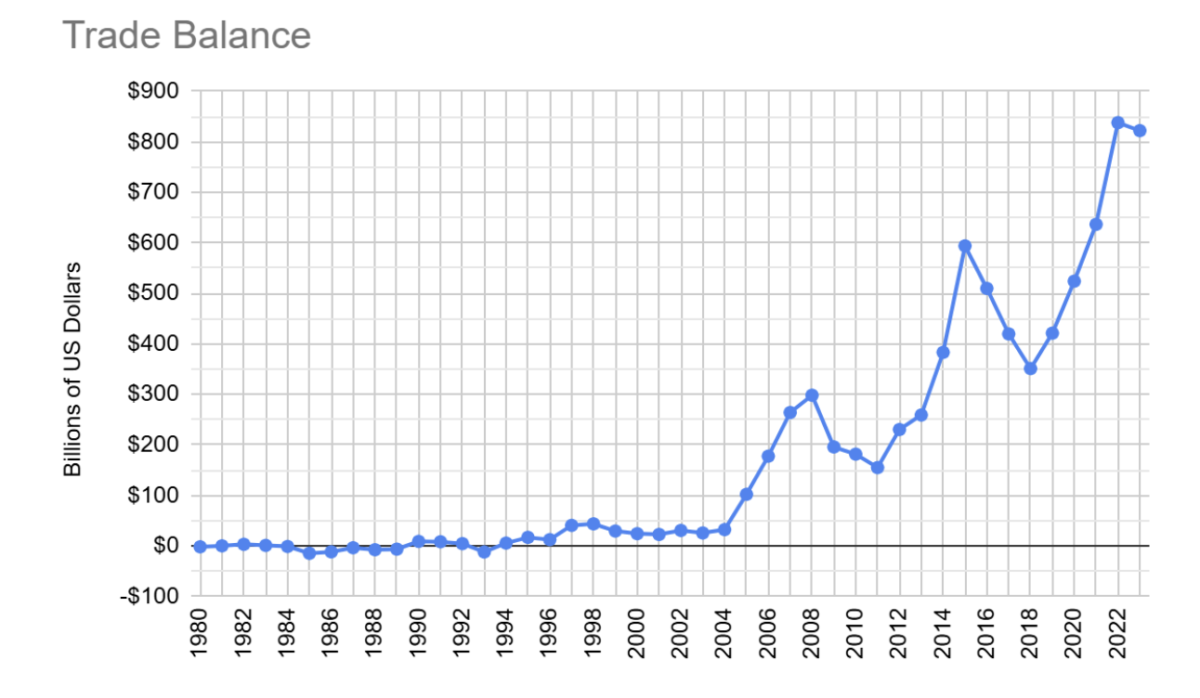
Source: National Bureau of Statistics, China
Alongside this spectacular growth in total exports relative to imports, the mix of China’s exports has changed substantially. In 2002, textiles constituted 26% of China’s exports. By 2021 the share of textiles had fallen to 14%. In contrast, the share of Chemicals, Machinery, Electronics, and Vehicles taken together has risen from 54% to 68% over the same period. This transition to more sophisticated manufacturing has been a feature of the east asian economic development paradigm: Japan, South Korea, and Taiwan have had very similar trajectories before.
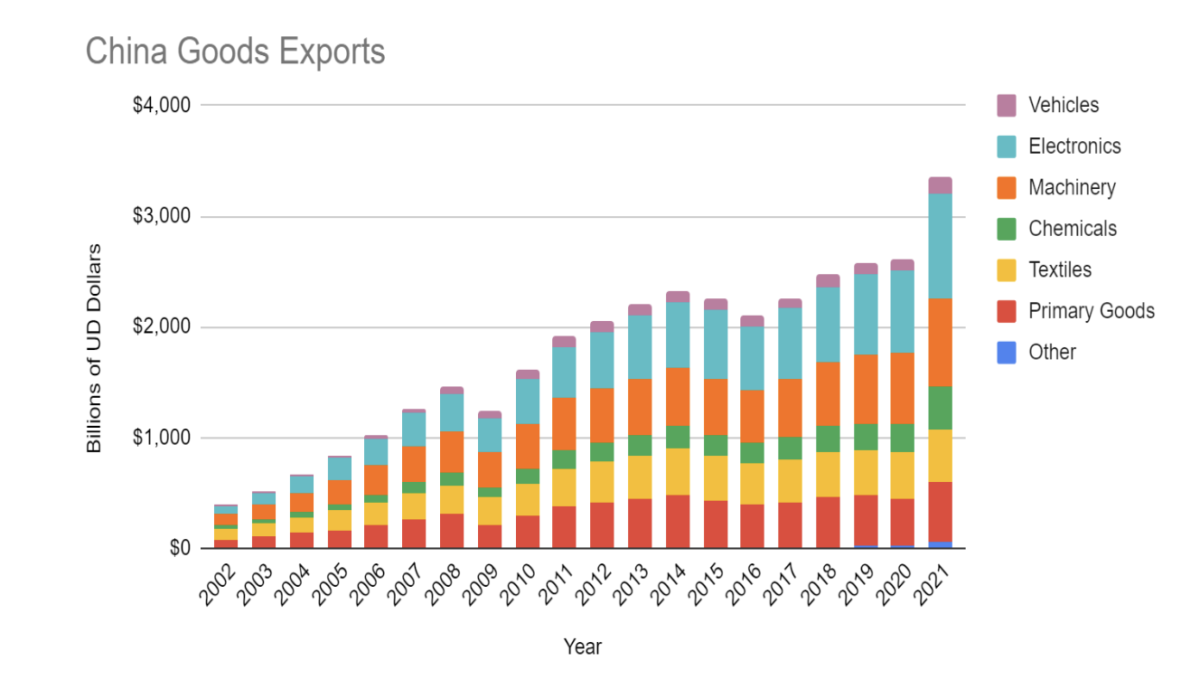
Source: The Growth Lab at Harvard University. The Atlas of Economic Complexity
The transition to higher value added manufacturing is reflected in its automobile sector and in the new energy industries of electric batteries and solar panels.
Autos
China became the largest manufacturer of motor vehicles in 2009, but most of its vehicles were generally built for its domestic market. In 2023, China produced some 30.1 million vehicles of which it exported 4.9 million. By some accounts, it became the top exporter of vehicles in the world in 2023, but the claim is unsupported by differing data sources. Nevertheless, it is close to the top, thanks to dramatic surges in exports in the last two years: by 57% in 2022 and 64% in 2023. Demand from Russia has been a major contributor to China’s exports in the last couple of years - Chinese vehicles have replaced those from Japan, Europe, the US, and Korea following the Russian invasion of Ukraine and ensuing sanctions.
Globally, one major development in the auto industry is the increasing share of electric vehicles in auto sales. According to the International Energy Agency, 18% of cars sold worldwide in 2023 were electric cars, having grown from just 2% in 2018. China accounted for 60% of the sales, and along with Europe and the US, made up 95% of the worldwide market. Even though a bulk of China’s electric car production is absorbed by its domestic market, exports are also rising fast. Out of the 4.9 million vehicles China exported in 2023, 1.2 million were electric or hybrid electric cars. Interestingly, 22% of these exports came from manufacturing plants of foreign companies in China.
It is remarkable that China’s emergence as a top vehicle exporter has occurred despite the fact that Chinese vehicles are absent from the world’s largest export market, the United States. The attention-grabbing 100% tariff imposed by the US on Chinese electric cars makes it infeasible for Chinese electric carmakers to penetrate the US market anytime soon, but worldwide demand is proving to be the catalyst for the growth in Chinese exports. Apart from Russia, which accounts for about 19% of China vehicle exports, several countries in Europe, Latin America, the middle east, and southeast Asia also import significant numbers of vehicles from China.
Batteries
Lithium-ion batteries, commercially introduced in 1991, have become ubiquitous in portable electronic devices, laptops, and mobile phones. More importantly, they have been crucial to the widespread adoption of electric vehicles. Electric vehicles have become feasible mainly due to the remarkable improvements in energy density and a 98.5% cost reduction in lithium-ion batteries over the last three decades, from $7,523/kWh in 1991 to $115/kWh in 2024.
China, with its rapidly expanding electric vehicle market, accounted for 54% of lithium-ion battery demand in 2023. However, it is dominant in battery manufacturing, with a 90% plus share of electrode active materials capacity, a nearly 100% share of lithium-iron-phosphate battery capacity and a 75% -plus share of nickel-manganese-cobalt battery capacity.
Solar Panels
Worldwide electricity production using solar energy has increased more than 50-fold from 32 TWh in 2010 to 1630 TWh in 2023. This has been enabled by the steep decline in the cost of solar panels, from $5 per watt in 2007 to $0.31 per watt in 2024, even as installed capacity has gone up more than tenfold. These cost reductions have been accompanied by massive increases in production capacity, mostly in China. As a result , China has a more than 80% share of the capacity in all the stages of solar panel manufacturing (polycrystalline silicon, wafer, cell and panel production).
Trade tensions
China’s path to dominance of world manufacturing and exports has caused concern among its rivals and trading partners. The US has been particularly vocal about China's trade practices over the years. This was driven by alarm over the rapid pace of growth in US imports from China, which rose from $100 billion in 2000 to $538 billion in 2018. In the first decade after China’s accession to the WTO, there were frequent complaints that it was manipulating its currency in order to boost exports, though the complaints subsided by the middle of the next decade as the Renminbi appreciated.
In 2018, the Trump administration initiated a trade war, with Trump claiming that "trade wars are good, and easy to win". In August 2019, China was labeled a “currency manipulator’’ by the US Treasury. Although the designation was reversed in January 2020 following negotiations, the trade tariffs were not lifted. The Biden administration continued the tariff policy. As a consequence of the initiation of the trade war, US imports from China did see a two-year decline after 2018, but rose again in the aftermath of the Covid-19 pandemic, before falling in 2023.
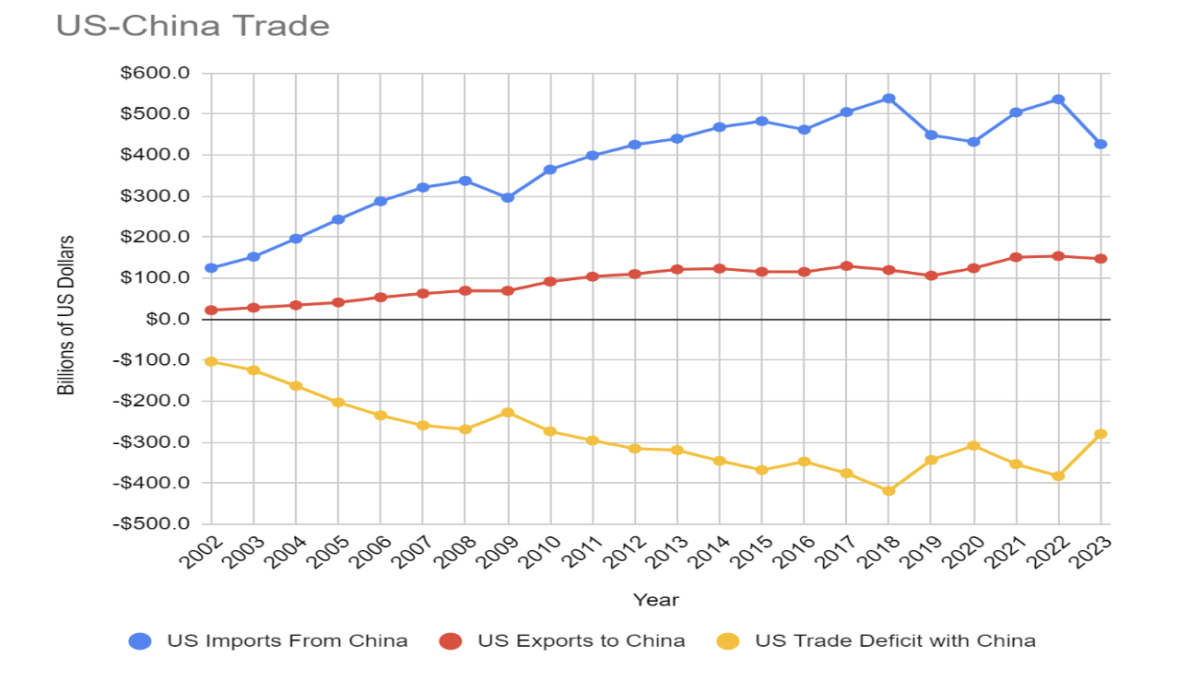
Source: US Census Bureau Foreign Trade Data
In September 2024, the US Trade Representative Office finalized major tariffs on Chinese products: 100% on electric vehicles, 50% on solar cells, and 25% on electrical vehicle batteries. Imports of some minerals and steel and aluminum also face a 25% tariff. Semiconductors will attract a tariff of 50% from 2025 onwards. Alongside these products, the list also contains decidedly low tech things like face masks, medical gloves, and syringes and needles. An additional 10% duty on all imports from China has been imposed by the second Trump administration, with the declared goal of disrupting an alleged supply chain of synthetic opioids.
Despite similar concerns in the European Union, a vote in October 2024 to impose steep tariffs on imports from China was not unanimous, with only 10 states reportedly voting in favour, 5 voting against the move, and 12 abstaining. Germany was the most notable opponent of EU tariffs on Chinese products, driven by concerns that countermeasures by China may hurt its exports and investments. Nevertheless, in late October, the European Union imposed additional tariffs of up to 35% on top of an existing 10% duty on imported cars from China.
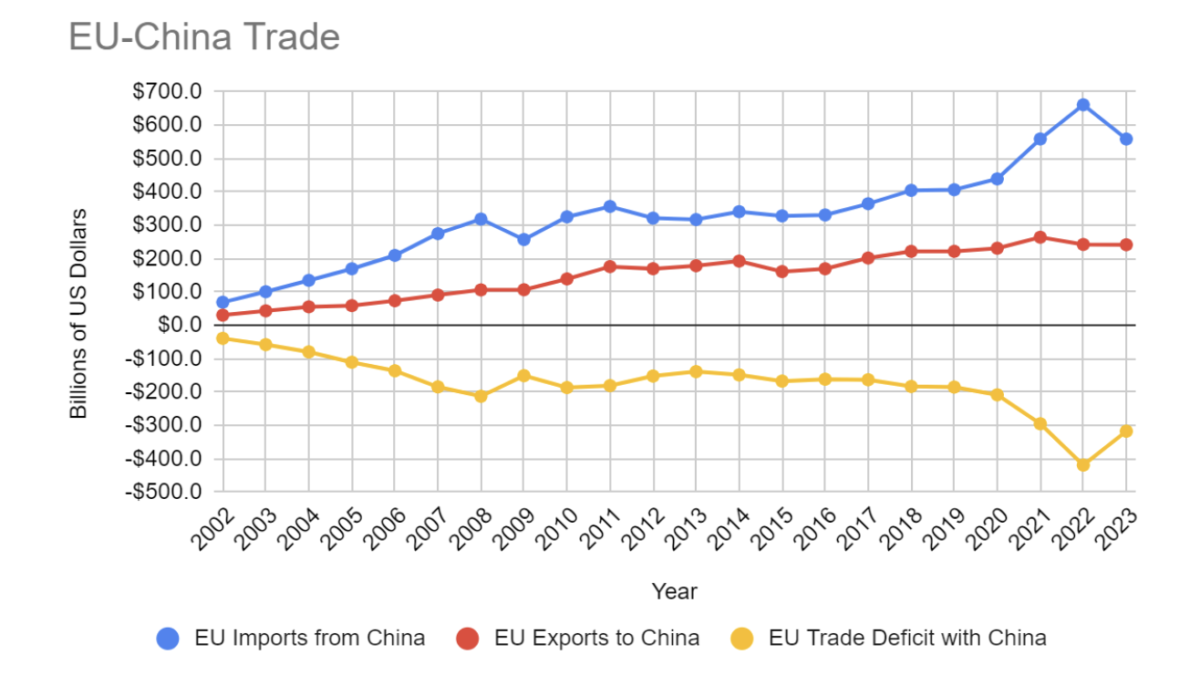
Source: Eurostat Data
What about India? Despite the territorial disputes and border clashes over the last few years, India’s imports from China have more than doubled, from $48 billion in 2013 to $117 billion in 2023. Exports to China, on the other hand, have hovered around $18 billion (though 2021 was an exception, with $28 billion in exports). This has resulted in India’s trade deficit with China ballooning to nearly $100 billion in 2023.
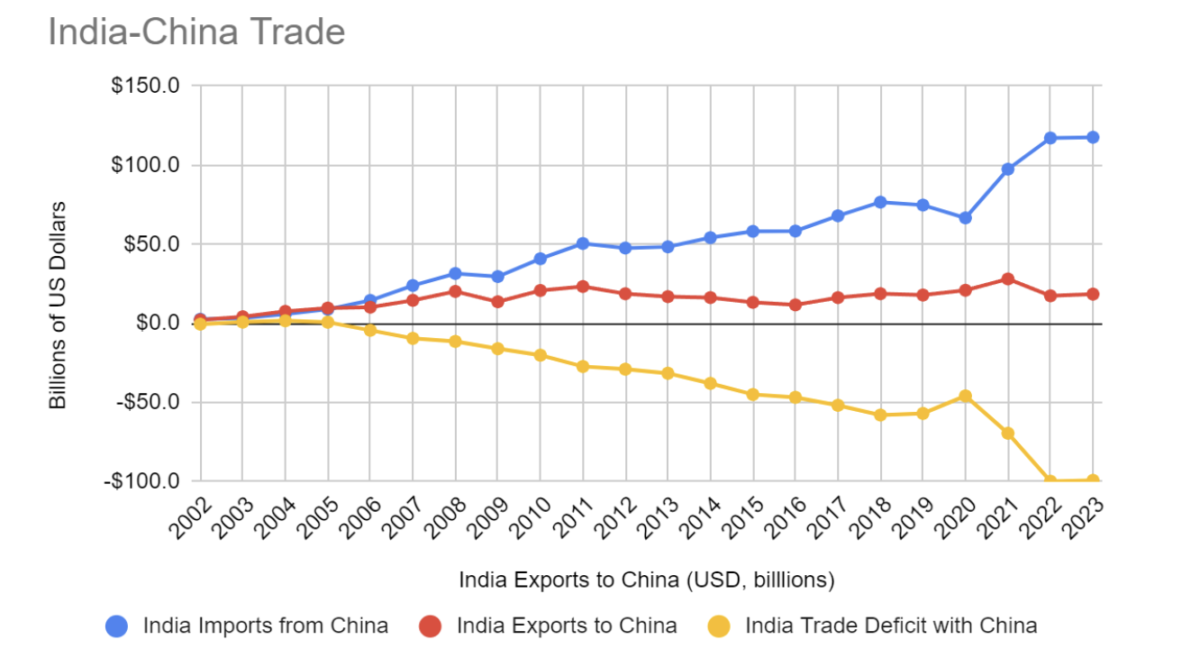
Source: National Bureau of Statistics, China
Among other developing economies, Brazil, Mexico, Thailand have imposed or increased anti-dumping duties and tariffs on Chinese steel imports. China is the world’s largest producer and exporter of steel.
Overcapacity
One term gaining currency to describe China’s production excesses is overcapacity. While it is an intuitive term, it is sometimes pointed out that the term has no consensus definition, and that the WTO does not recognise such a phenomenon. However, there is a good case for excess capacity in several industries in China. Its overall industrial capacity utilisation rate has hovered around 76% over the last couple of years, being about three percentage points lower than that in the US and the EU.
However, specific industries have much lower utilisation rates: 30% in glass and cement and 57% in silicon wafer manufacturing, for example. There are other symptoms of excess capacity as well, such as the fact that local demand for lithium-ion batteries was only 25% of projected capacity in 2024 and the steep declines in solar panel prices due to oversupply. These trends have not gone unnoticed in China – after initial denials of an overcapacity problem, China’s leadership has expressed concerns about inefficient “involutionary competition” within the country that has led to price wars, shrinking profit margins, and potential insolvencies.
The interesting question is how this and other previous episodes of excess capacity develop. Occasional imbalances between supply and demand due to inaccurate projections can occur in any country, but one unique factor in China is the role of local governments. Contrary to the general perception of how autocratic states function, China’s economy is significantly decentralised, notwithstanding political centralisation and the authority of the Chinese Communist Party. In 2023, for example, nearly 86% of total government expenditure was undertaken by local governments. Economic policy objectives set by the central government focusing on specific industries lead to fierce local government competition to promote those industries. The incentives offered to companies include subsidised credit, lower taxes, and favourable land policies. The competition then results in uncoordinated investments, continuing support for unprofitable firms, and increased supply that far outstrips domestic demand.
As outlined above, several countries and the European Union have reacted to China’s manufacturing and export dominance with tariff barriers. However, it is not clear that these responses are beneficial for all constituencies within the country imposing the tariffs. Importers will generally pass on the cost of additional tariffs to consumers, so consumers will face higher prices, at least until other low cost sources are found. Local industry will benefit to some degree, since lower cost competition is eliminated. A good example of this is the electric vehicle market. In the US, a Tesla Model 3 currently costs $42,490 (before a tax credit of $7,500). A comparable car from BYD, the leading Chinese manufacturer costs about $25,000 in China. The 100% tariff imposed by the US would raise that cost to $50,000, thus ensuring that BYD electric cars are not going to be imported at any significant scale. This qualifies clearly as protectionism that benefits Tesla.
Apart from the higher prices that consumers have to pay, tariffs on new energy products such as electric vehicles, batteries, and solar panels also undermine environmental goals. If the world is to have any hope of mitigating climate change, it has to move away from fossil fuels. Lower prices resulting from China’s overcapacity in new-energy sectors increases the economic incentives for people the world over to switch over to non-fossil-fuel sources of energy and transportation.
In any case, there are multiple reasons why tariffs will not push China to comply with US and European demands to rebalance its economy away from investment and towards private consumption. China’s economic policymaking at the national level displays a dominant concern with production rather than with consumption. Second, there are several perfectly feasible economic responses: retaliatory tariffs, currency depreciation, and routing exports through third countries. Third, rising nationalism and an established historical narrative of a “century of humiliation” (from 1839 to 1949) at the hands of foreign powers make it very unlikely that China will yield to economic coercion.
Despite its manufacturing prowess, China’s economy has been facing a prolonged economic slowdown, as it emerges from the collapse of a real estate and infrastructure bubble. Youth unemployment has been hovering in the high teens and falling prices point towards deflation. For several years now, many observers have highlighted that China needs to shift away from investment-oriented growth to a more balanced economy where private consumption plays a bigger role. Recent statements by the governor of the central bank and China’s premier reflect official recognition of the need for this shift. It remains to be seen whether the shift will be accomplished, but for now, the slowdown indicates that the years of China’s miracle growth might be past.
Vijay Poduri is a quantitative finance researcher based in the San Francisco bay area. He has a Ph. D. in Physics and is a CFA charterholder. He has a deep interest in economic history and development and is working on a book on the prosperity of nations.
The Wire is now on WhatsApp. Follow our channel for sharp analysis and opinions on the latest developments.


