
The Truth About Inflation – in India and Around the World
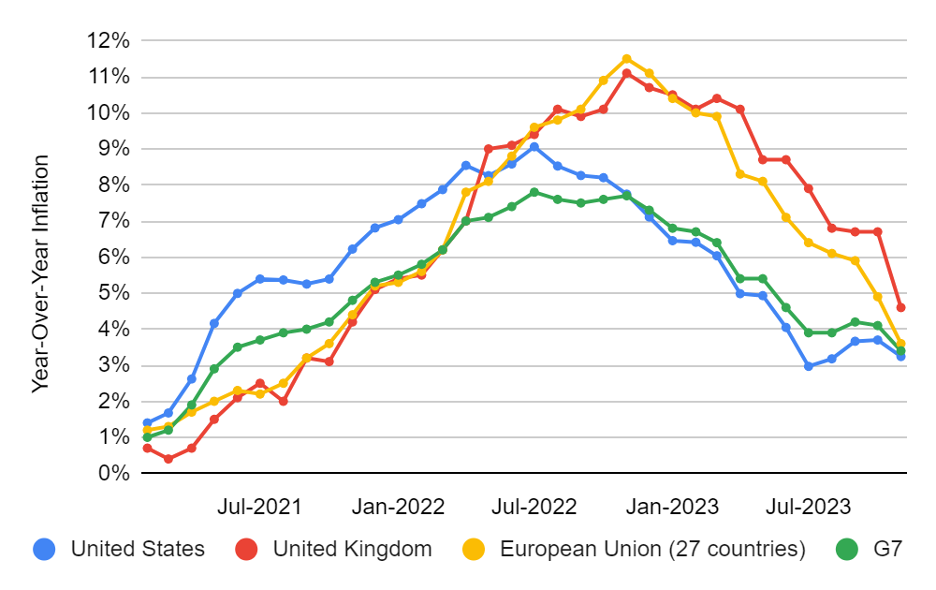
In mid 2021, as the world emerged from the Covid-19 pandemic, prices started rising in multiple countries. Inflation reached levels not seen for decades in several advanced economies. In the US, for example, year-over-year inflation breached the 5% threshold in May 2021 and stayed above that level for more than a year, peaking at over 9% in June 2022. US inflation has exceeded 5% only twice since November 1982, once for a few months in 1990-1991, and for a second time briefly in mid 2008.
Source: Organization for Economic Co-operation and Development, OECD.Stat
There were several reasons for this worldwide inflationary surge, including supply chain disruptions, pent-up demand being released as many countries went back to pre-pandemic modes of life, sharp increases in food and energy prices following the Russian invasion of Ukraine, and corporate profiteering. In addition, large fiscal stimuli provided by governments boosted demand further.
There has been much discussion about the nature of this bout of inflation among academics, policymakers and analysts in the US. The debate is between those who think this inflation is transitory and others who believe that it is persistent. This naturally leads them to advocate for different policies. Those who fear persistent inflation have claimed that post-pandemic stimulus packages were too large, and that the Federal Reserve should raise interest rates to tame inflation, even at the risk of triggering a recession.
Also read: What Do We Really Know About India's GDP?
The steady disinflation seen globally during 2023 seems to be settling the debate in favour of the interpretation that the surge was transitory. US inflation in November 2023 was at 3.1%.
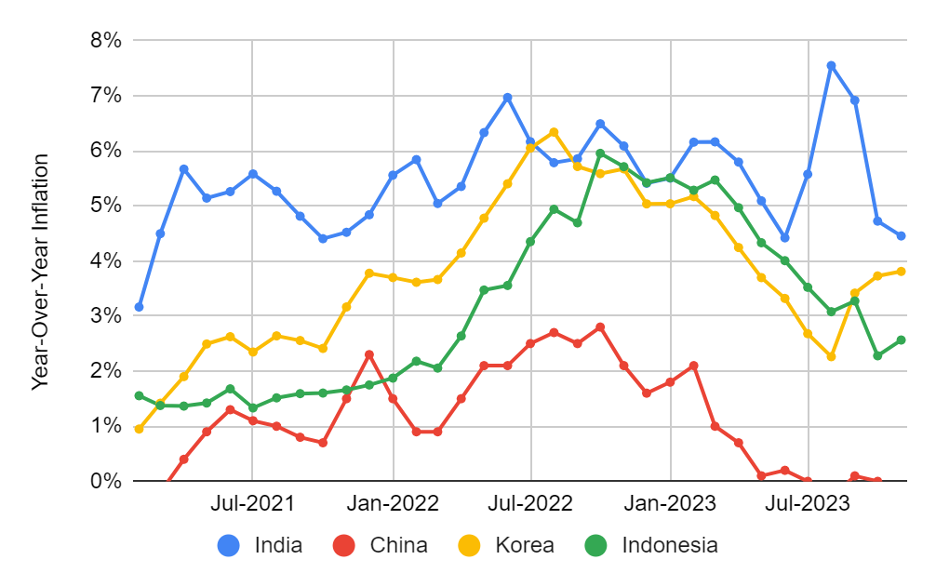
The patterns in inflation in the West are quite different from those in Asia, as seen in the figure below. Inflation was muted in China, fluctuated around the 6% level in India, increased for a few months in 2022 and then subsided in Korea and Indonesia. This suggests that the underlying factors at work in the West and in the rest of the world may be quite different.
 Source: OECD data
Some history
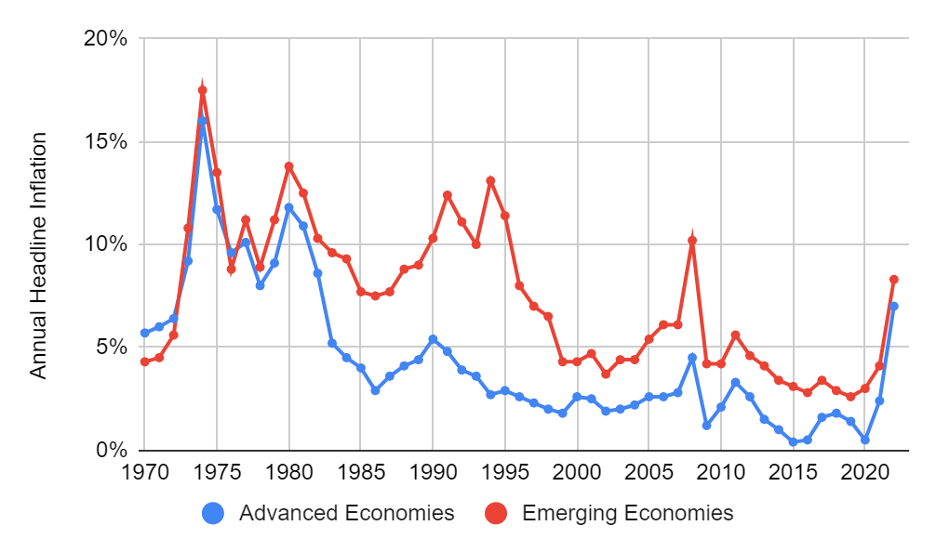
The World Bank now provides a database of inflation in countries around the world going back to 1970. The figure below shows the median inflation in advanced economies and emerging economies and gives us a good overview of the phenomenon over the last 50 or so years.
 Source: World Bank Inflation Database
The big spike in all countries in the early 1970s occurred due to two major global supply shocks. The first was a global increase in food prices, resulting from serious shortfalls in grain production in 1972 in Russia, India, China, Australia, etc. The second was a jump in the price of oil roughly from $3 per barrel to $12 per barrel, initiated by the late 1973 oil embargo imposed on several developed countries by the Organization of Arab Petroleum Exporting Countries (OAPEC), in retaliation for their support of Israel in the 1973 Arab-Israeli conflict. The embargo ended in March 1974, but oil prices remained high.
The second spike in 1980 was again due to the double whammy of a jump in food prices and an oil price shock which followed the Iranian revolution – crude oil went from about $13 per barrel in mid-1979 to $34 per barrel in mid-1980.
After 1980, the advanced economies of the world saw a more or less steady decline in inflation, with the median falling below the 5% level in 1984 and staying there until 2021, except for a couple of short-lived spurts: one in 1990 following the Iraqi invasion of Kuwait and the second in 2008 during the global financial crisis. The long period of low and relatively stable inflation from 1984 to 2007 in the advanced economies has been dubbed the Great Moderation.
In contrast, inflation in emerging economies remained elevated until about 1995, after which it started declining. After 1995, inflation in the two groups of countries seems to have moved in tandem, though the levels in emerging economies remain higher.
India’s track record
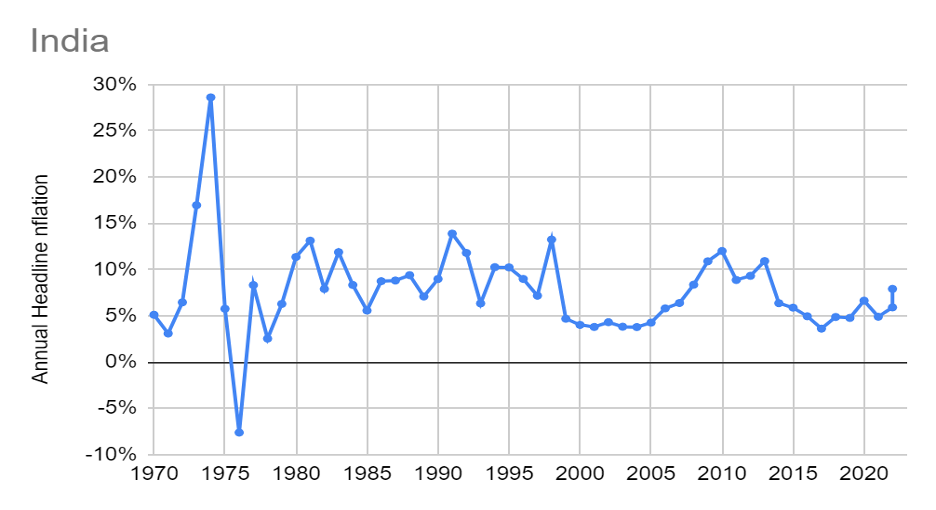
India suffered from high inflation during the 1970s due to the same reasons as the rest of the world: food and energy price shocks. The severity of the food price shocks was higher in India due to droughts in 1971, 1972, and 1974, combined with crop losses due to floods in 1974 as well. Combined with the global oil price shock, this led to annual inflation of 17% in 1973 and 29% in 1974. These high levels were mercifully short-lived, and the price rise was mitigated somewhat by deflation in 1976. Since then however, prices have risen every year.
 Source: World Bank Inflation Database
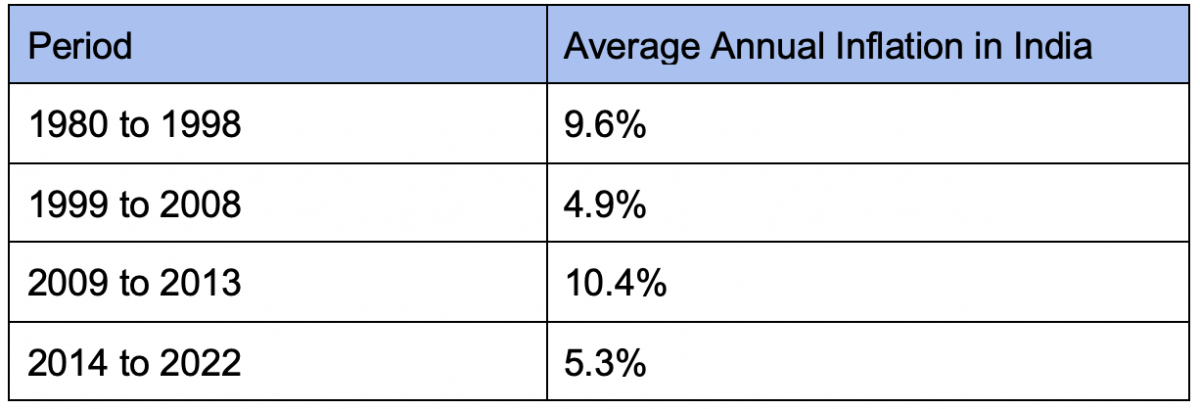
Ignoring the volatile 1970s, inflation in India has fluctuated around two approximate levels: 10% and 5%. As shown in the table below, for nearly two decades starting in 1980, the average annual inflation was at 9.6%. This fell to about 5% for the next decade, but spiked from 2009 to 2013, again due to significant food price inflation, before reverting to the 5% level from 2014 onwards.
 Source: World Bank Inflation Database
Food inflation is a major driver of overall inflation in India. Since food is such a significant part of consumption expenditure, it has a 45.9 % weight in the 2012 base year consumer price index. Other emerging economies have large weights for food as well. In contrast, price indices in advanced economies assign much smaller weights to food – the average for G-7 countries excluding Japan is about 12%.
Inflation in India compared with that in other countries
The tables below highlight the experience of inflation over the last five decades in selected advanced and emerging economies. As mentioned earlier, the advanced economies have all seen low inflation since the mid 1980s. India’s inflation has generally been higher than that in G-7 countries, with the exception of the UK and Italy in the 1970s and 1980s.
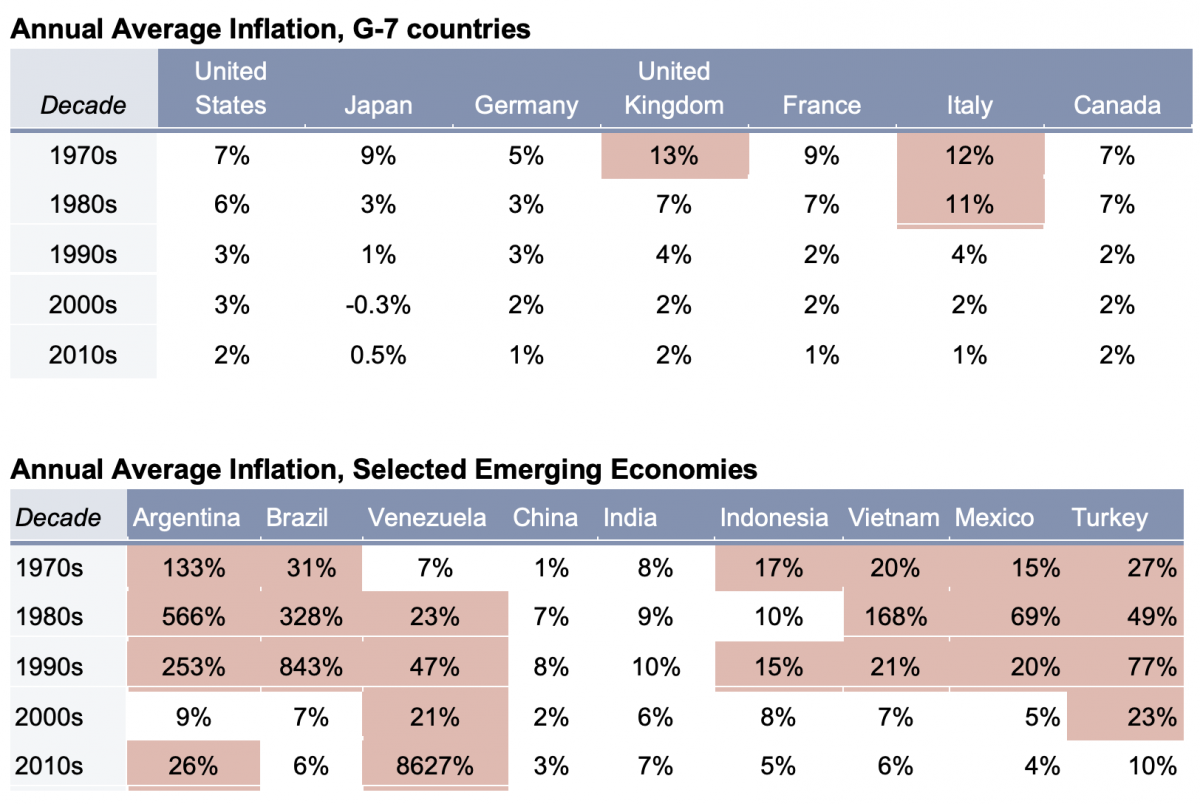 Highlighted cells indicate annual rates greater than 10%
Source: World Bank Inflation Database
India has generally fared much better when compared with other emerging economies, with the exception of China. Latin American countries such as Argentina, Brazil, Mexico and Venezuela have struggled with high or hyperinflation multiple times.
Despite India’s experience with inflation being milder when compared to several other emerging countries, the 10% level is nothing to be complacent about. With 10% annual inflation, prices double in a little over seven years and can lead to a major erosion in purchasing power, since wage growth generally lags behind inflation, particularly in the informal sector.
Even when overall inflation is at the 5% level, prices for specific categories of goods may be rising faster, causing significant distress. For example, in November 2023, while year-over-year overall inflation in India was 5.6%, food inflation was at 8%.
Extremes of inflation around the world
Hyperinflation is defined, by convention, as inflation rates exceeding 50% per month (or an astonishing 12,875% per year). Based on this definition, more than 50 episodes have been identified in the 20th century. The German hyperinflation of 1923-24 was one such very consequential instance – it is often described as one of the reasons for the rise of the Nazi party and Hitler.
The exchange rate for the German papiermark, the currency at the time, rose from 320 marks per US dollar in mid 1922 to a mind-boggling 4.2 trillion marks per US dollar by November 1923. Stories of people carrying banknotes in wheelbarrows to go shopping during that period abound.
Such economic catastrophes, usually occurring in the aftermath of major wars, declined after the end of the second world war. Hyperinflation re-emerged in the 1980s in Latin America and in the 1990s in eastern Europe after the collapse of the Soviet Union. In the 21st century, two countries have experienced hyperinflation: Zimbabwe, starting in 2007, and Venezuela, starting in 2017. Venezuela is still reeling from the effects, with current annual inflation at 283%.
Also read: In 9 Charts: India’s Growing Debt Problem Has ‘Crisis-Like Symptoms’
While hyperinflation is fascinating to contemplate, it is relatively rare. Far lower levels of inflation are also extremely disruptive and damaging. Annual inflation of 25%, for example, means a doubling of prices in a little over three years. In the World Bank Inflation database, a little over 10% of annual observations are above that threshold.
Turkey provides one such example. It has had an average annual inflation of 37% over the last five decades. According to OECD data, in October 2022, year-over-year inflation in Turkey was 85.5%. This has come down a little bit, but is still very high, at 62% in November 2023.
Turkish President Recep Tayyip Erdogan has been pushing for lower interest rates for years (calling interest rates the “mother of all evil” in 2018) to combat inflation, contrary to all economic experience and logic. Turkey seems to have finally reversed course recently, with its central bank raising benchmark interest rates rapidly since June 2023, from 8.5% to 42.5%. Turkey is clearly an extreme case, but the experience of many countries over the last several decades has led to the realisation that central bank independence is necessary to curb high and runaway inflation.
At the other extreme of the inflation range lies Japan. For the 40-year period from 1982 to 2022, average annual inflation in Japan has been 0.7%. For 15 of those years, it has experienced deflation, or declining prices.
Money and inflation
Inflation is often described as “too much money chasing too few goods”. More fundamentally, prices rise due to a mismatch between demand and supply. For a single good or service, an increase in demand or a decrease in supply will cause its price to rise. In the context of the overall economy, this argument is extended to aggregate demand and aggregate supply.
It is of course possible for the prices of goods in some categories (often, food and energy) to rise significantly while others remain stable or rise only modestly. This phenomenon, described as a change in relative prices in the consumption basket, is commonly encountered in many countries.
The more complex case is that in which all prices seem to be rising. One explanation is that such general inflation is the result of increases in money supply. In this context, people often quote Milton Friedman, US economist and the winner of the 1976 Nobel Economics prize, who said, “Inflation is always and everywhere a monetary phenomenon in the sense that it is and can be produced only by a more rapid increase in the quantity of money than in output.”
Friedman’s dictum has been used, usually by politically conservative economists, analysts and commentators, as the reason to oppose high government spending and monetary and fiscal stimuli in response to economic crises. It is thus worth asking if it is indeed true.
To begin with, Friedman was seriously overstating his case. When a statement uses phrases such as “always and everywhere” and “can be produced only by”, we need just a single counterexample to demonstrate that it is invalid. Such a counterexample is easy to obtain, for example for the US.
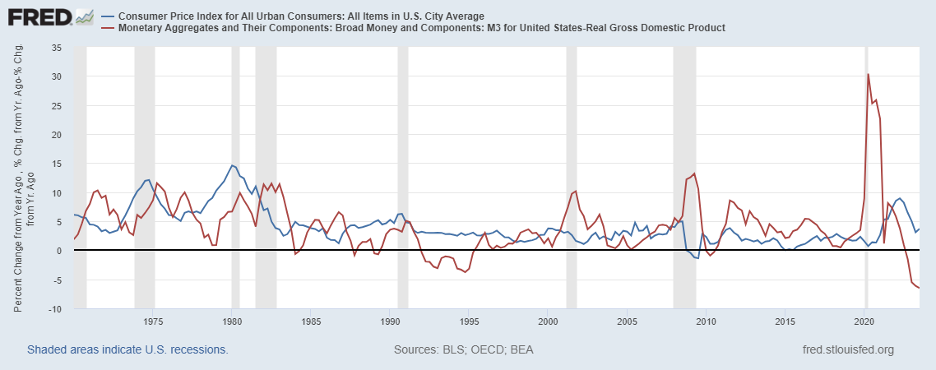
For the US, the correlation between inflation and growth in money supply in excess of growth in GDP, over the period Q1 1970 to Q3 2023 (215 quarters), is 0.09, which is far too low for a causal relationship. If we narrow the focus to the high inflation period of 1970 to 1985, when we might expect to see at least some relationship, the correlation is zero. A far cry from “always and everywhere”.
Despite the massive overstatement, there is a grain of truth in Friedman’s contention. Empirical research covering several countries has unearthed regimes where the relationship between money growth and inflation is important. A 2001 study covering 160 countries over 30 years found that the link exists for high and hyper-inflation episodes but is weak when annual inflation is less than 10%. More recent research based on data from 32 countries over the period 1951 to 2021 confirms the finding that the relationship is significant only for high inflation episodes.
This is useful knowledge. Typically, high and persistent inflation is a result of budget deficits run by governments and their monetisation by central banks. Economists refer to the government’s generation of revenue through deficit monetisation as seigniorage, but it is far more picturesque to call it “money printing”. Empirical experience shows that high inflation (say above 10% per year), generated by repeated deficit monetisation, can be quite difficult to get rid of.
On the other hand, low inflation, such as that experienced by advanced economies over the last three decades, has been attributed to several factors, many of which are becoming fundamental tenets of economic policy worldwide. Apart from central bank independence, these are: fiscal discipline, inflation targeting and the setting of interest rates as the primary control mechanism.
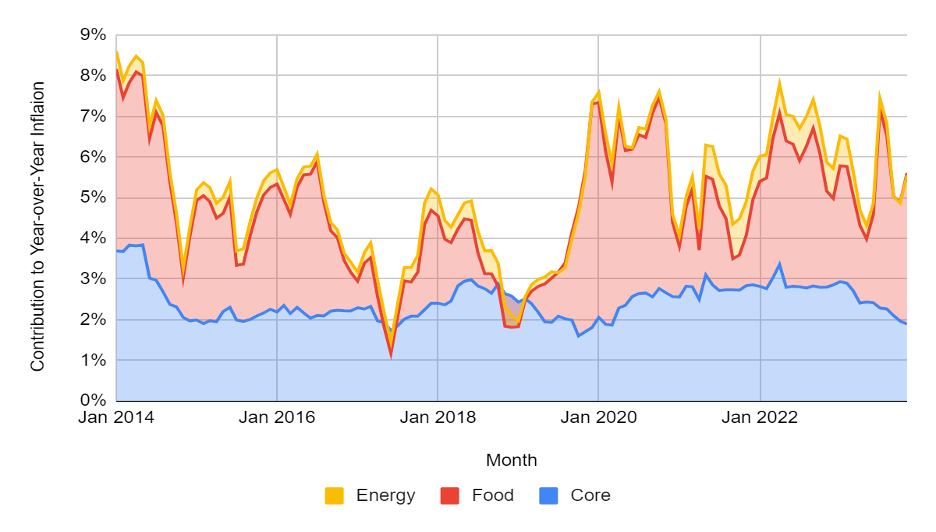
For India, it might be far more useful to focus on sectoral price changes than on monetary mechanisms. The figure below shows the contributions of food, energy and core inflation to overall inflation in India from 2014 onwards. Core inflation is derived from overall inflation by excluding food and energy categories.
 Source: Calculations based on RBI data
For this period, we see that core inflation mostly stays within the 2% to 3% band. A bulk of the inflation experienced by the Indian consumer comes from rising food prices. It is of course possible that core inflation is also affected by food and energy prices, but this is likely to be a smaller second order effect – as can be seen from the figure, where the contribution of food inflation is volatile, while the contribution of core inflation is relatively stable.
This suggests that Indian inflation is best tackled by addressing food inflation – which is clearly a government responsibility. The role that monetary policy can play in this context is limited.
Vijay Poduri is a quantitative finance researcher based in the San Francisco bay area. He has a Ph. D. in Physics and is a CFA charterholder. He has a deep interest in economic history and development and is working on a book on the prosperity of nations.
This article went live on January fourth, two thousand twenty four, at zero minutes past six in the evening.The Wire is now on WhatsApp. Follow our channel for sharp analysis and opinions on the latest developments.


